What I did in 2018 #
My plan, from a year ago, was:
- Produce explanations and demos from my procedural map generator experiments.
- Go back to old articles and update them.
- Work other developers on algorithms and articles.
- Write a tutorial on coordinate systems and cameras.
- Write tutorials about making interactive tutorials.
- Become faster at writing explanations.
What did I do in 2018? I think I did reasonably well with goals 1, 2, and 6, and not so well on goals 3, 4, and 5.
Labels: annual-review
Printing my pages #
Occasionally someone will want to print one of my web pages, even though it means losing access to all the interactive parts. There are a few things I do to make this work better:
- I try to start all my interactive diagrams in a state where it's informative without interaction. This is not only helpful for printing, but also for people skimming the page. I haven't always done this in the past so I've been trying to go back through my older pages and change them to work this way.
- I have a "print stylesheet" using @media print { … } that changes the page style when printing. It changes the font, removes background colors, removes text shadows, and instructs the browser to avoid breaking the page inside a diagram.
- (Added today) When printing, I display the URLs for the links on the page. Since you can't click the links, it's useful to display the URLs.
Website updates, part 3 #
While updating my website build process over the past week (part 1, part 2), I decided I should also revisit my page layouts. Last year, I started learning about responsive design, studied the theory, and implemented it on my site. I converted 514 out of around 600 pages, and said “The rest are either unimportant or impractical to convert.” Of the ones I didn't convert, some were in a 450px width and most in a 600px width. I wanted to see if I could convert the 450px pages to 600px at least.
Labels: design , infrastructure
Website updates, part 2 #
In part 1 I described some of the things I was doing to improve how my site is built. I had planned to implement the translation of each XHTML file to HTML in Python, but that didn't quite work out. I went back to my primary goals:
- Versioning of references to JS, CSS resources, so that I can improve browser caching of my pages.
- Tracking dependencies so that if something a page depends on is modified, the page is rebuilt.
- Custom macros for each project.
I was hoping to implement all of this in November before I started my December project, but I didn't. So I decided to focus on the most important part, versioning.
Labels: infrastructure
Website updates, part 1 #
I finished mapgen4 last week and wanted to "sharpen my tools" before I started the next project. My website is over 20 years old and spans 5 domains. The build process has grown over time, supporting all the different tools I've used over the decades.
There are a few features I've wanted to add to my static site generator:
- Versioning of js, css resources so that I can increase the expiration cache time. This should improve load time. I've been doing this manually and want to automate it.
- Dependency tracking, so that if something includes another thing, and that thing changes, the first thing gets rebuilt. This should reduce content mismatch errors.
- Custom macros for each project that get expanded at build time. This should make it easier to write new pages.
Labels: infrastructure
Mapgen4: finished #
“Not with a bang but a whimper”
Back in July, I started mapgen4, the successor to mapgen2, my Voronoi-polygon map generator from 2010. Back in August I posted that I had planned to finish the map generator “in a month”, and then write a tutorial.
That was three months ago.
Math explorables #
There are times when I'm on YouTube watching a math video that I think, “oh, that would be fun to play with!” What I should do is recreate the diagram in Desmos or Geogebra. But instead I just move on to another video. Recently I decided I should try making some diagrams, in part to improve my Javascript/web skills, but in part because it seemed like it'd be fun! So I did this for two math videos:
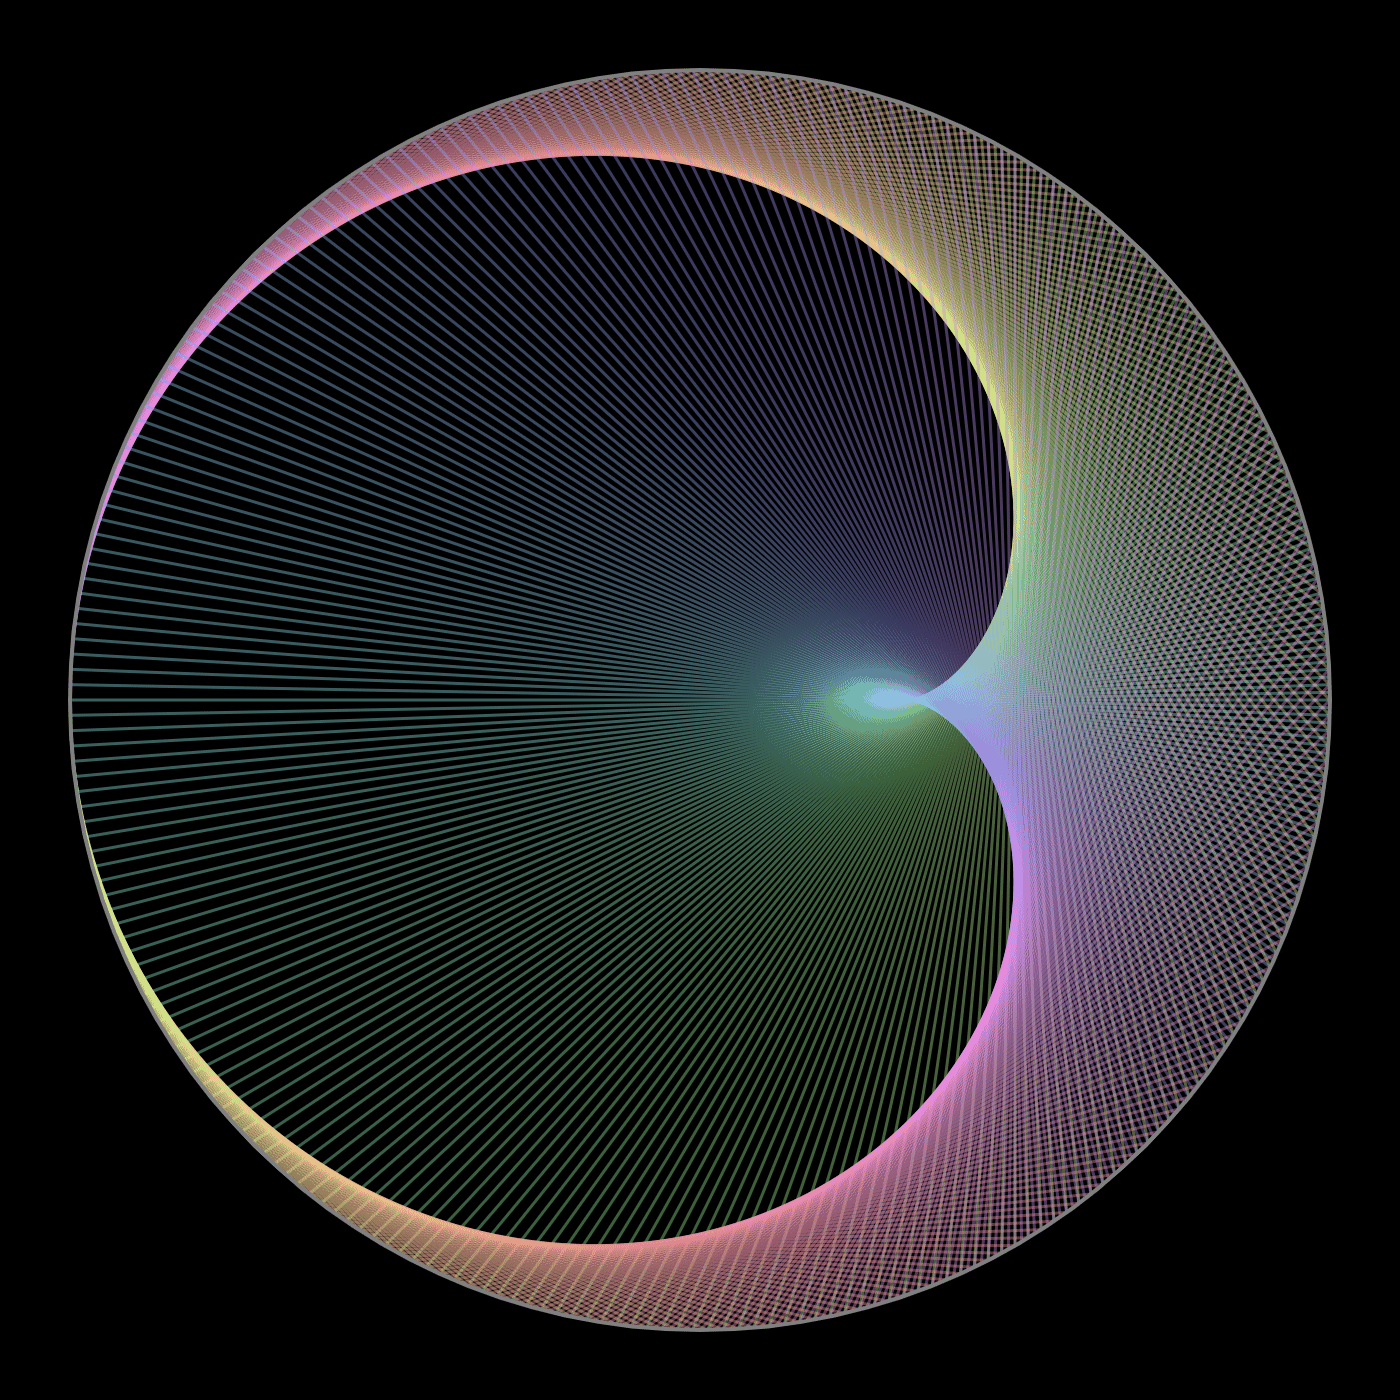
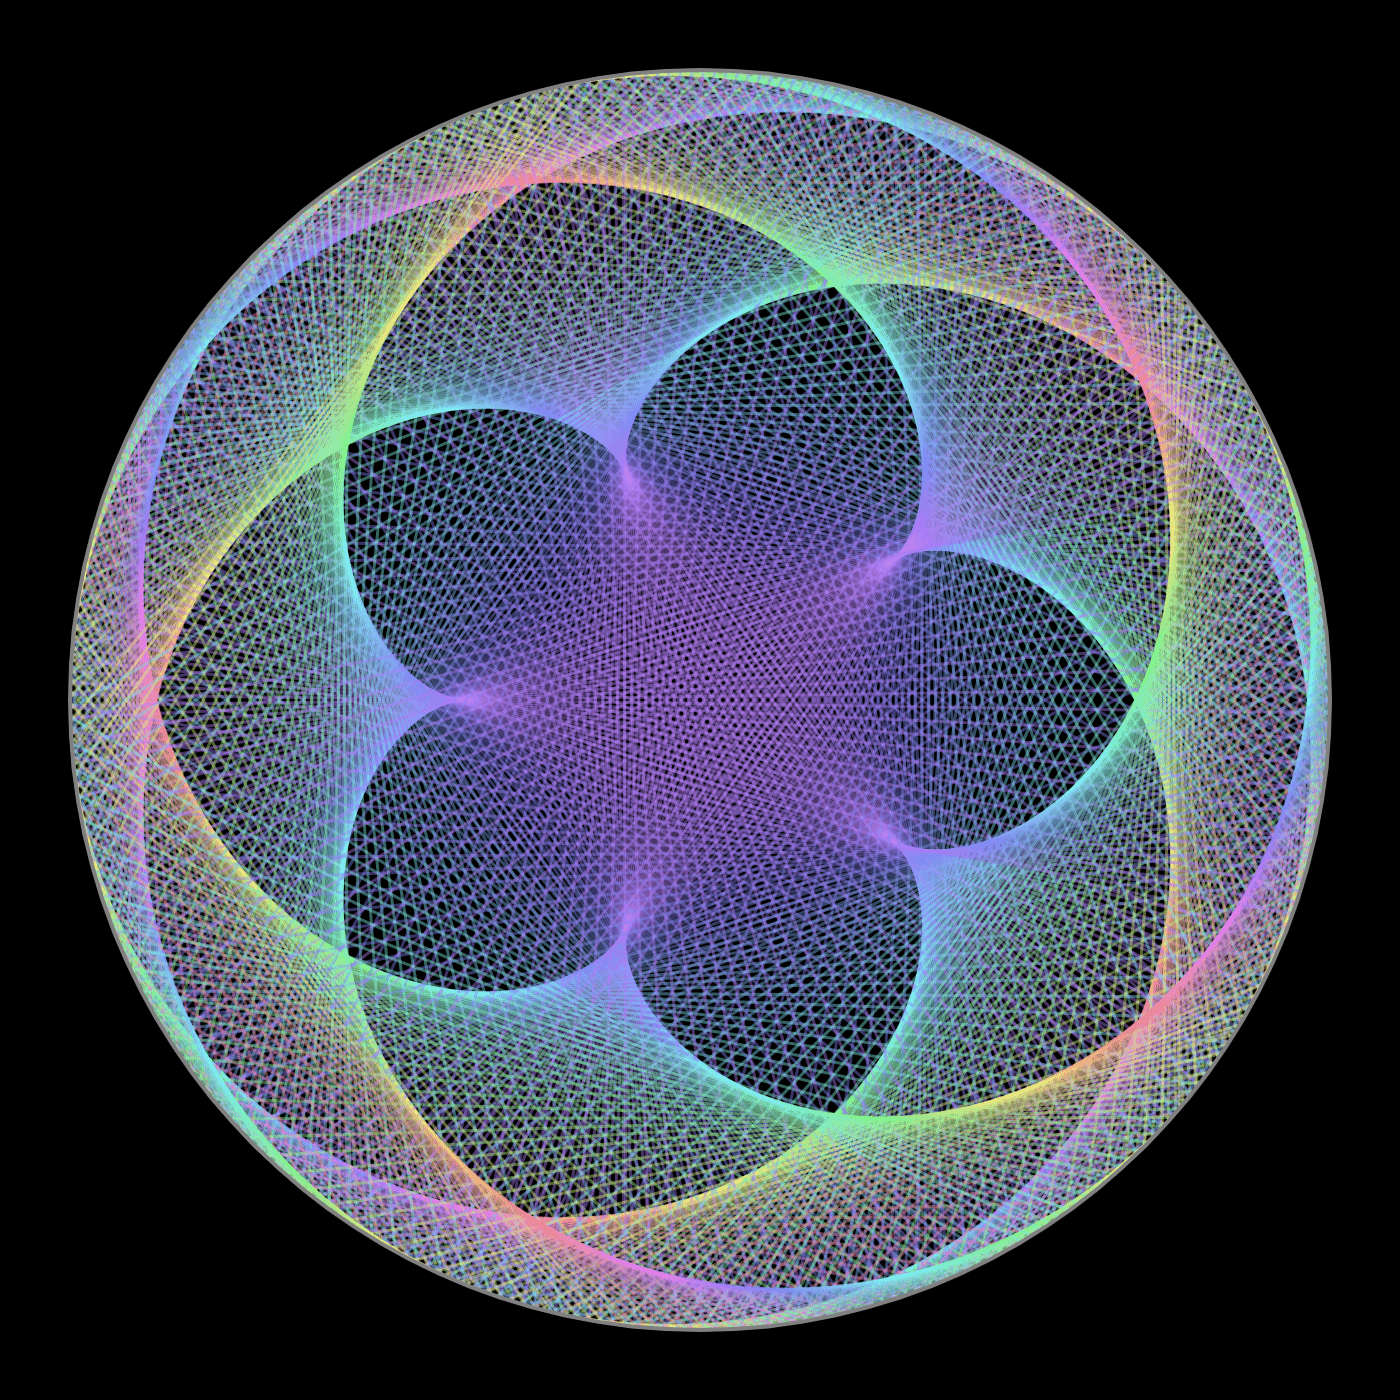
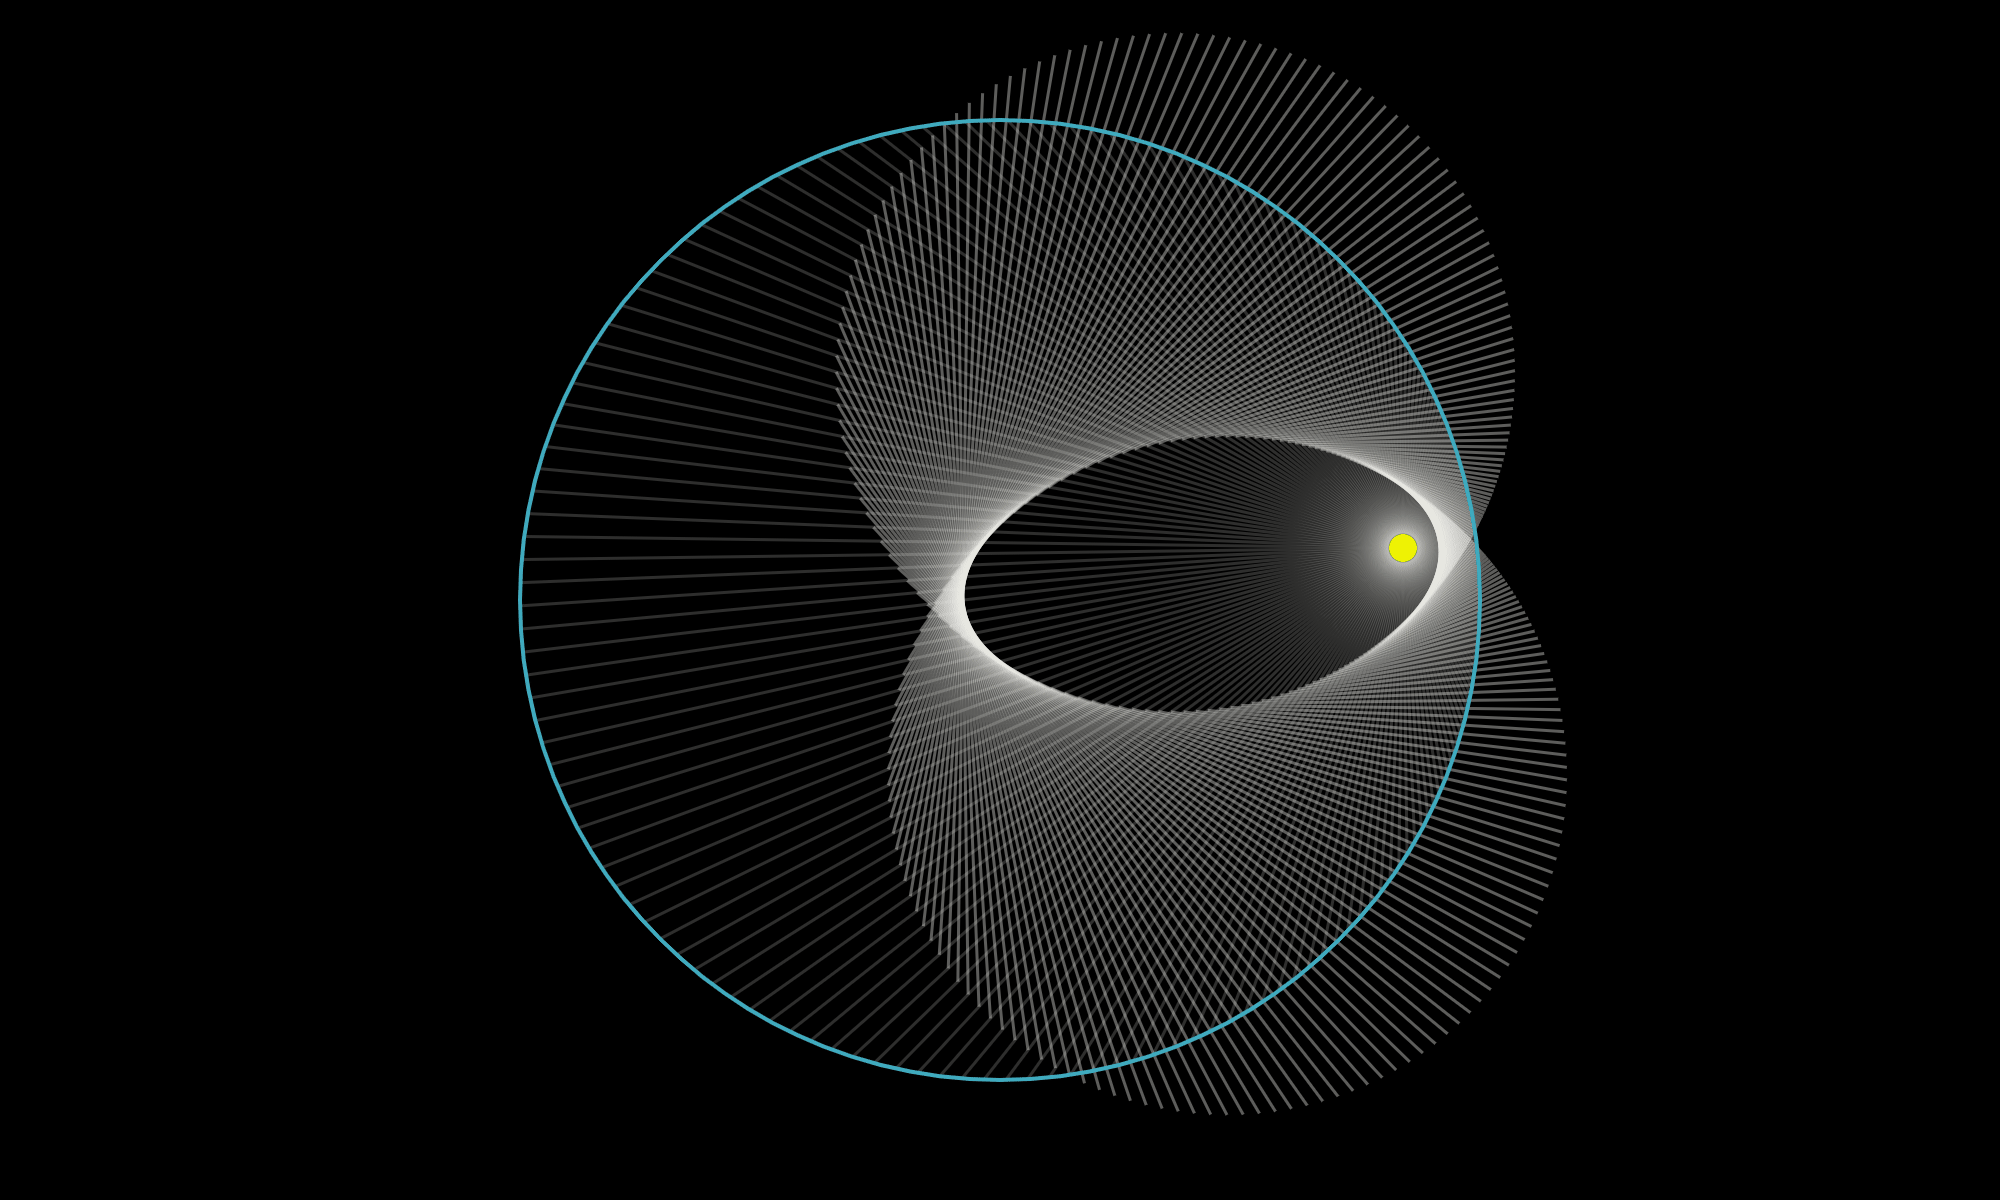
Both of these were quick, under an hour (mostly fiddling with colors, line widths, transparency, etc): an ellipse from line segments, multiplication with modulo on a circle.
Labels: math
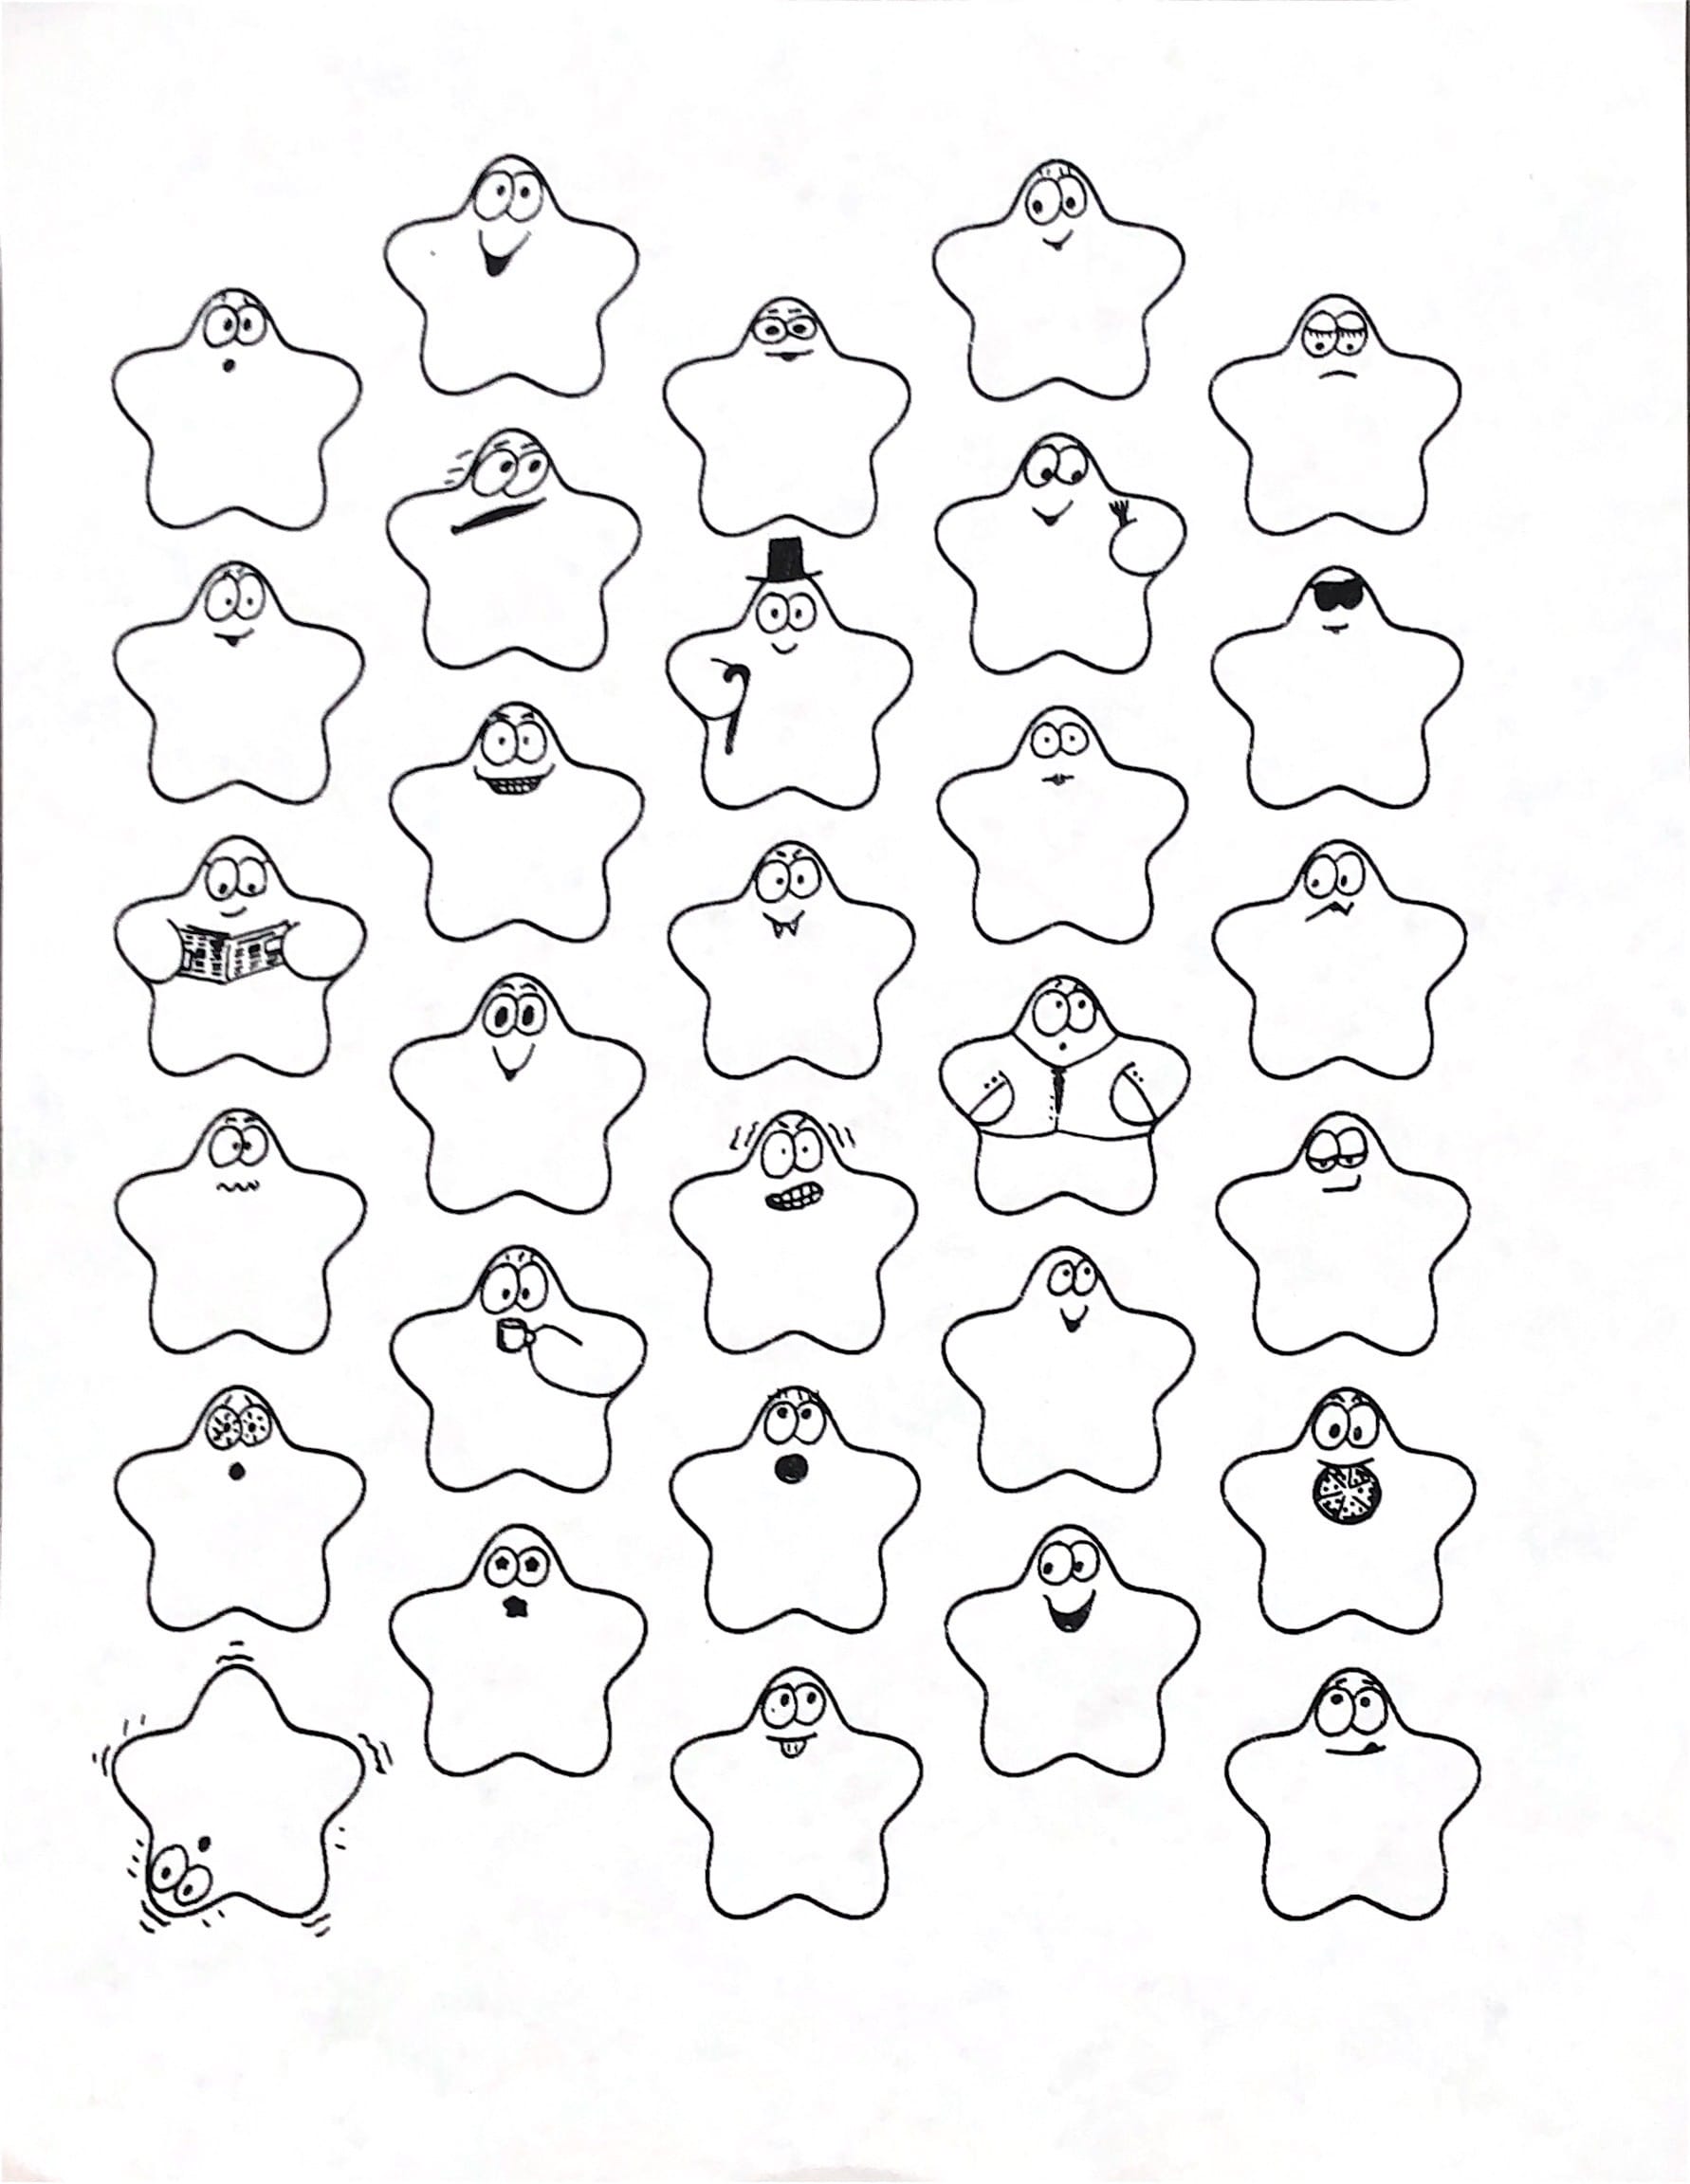
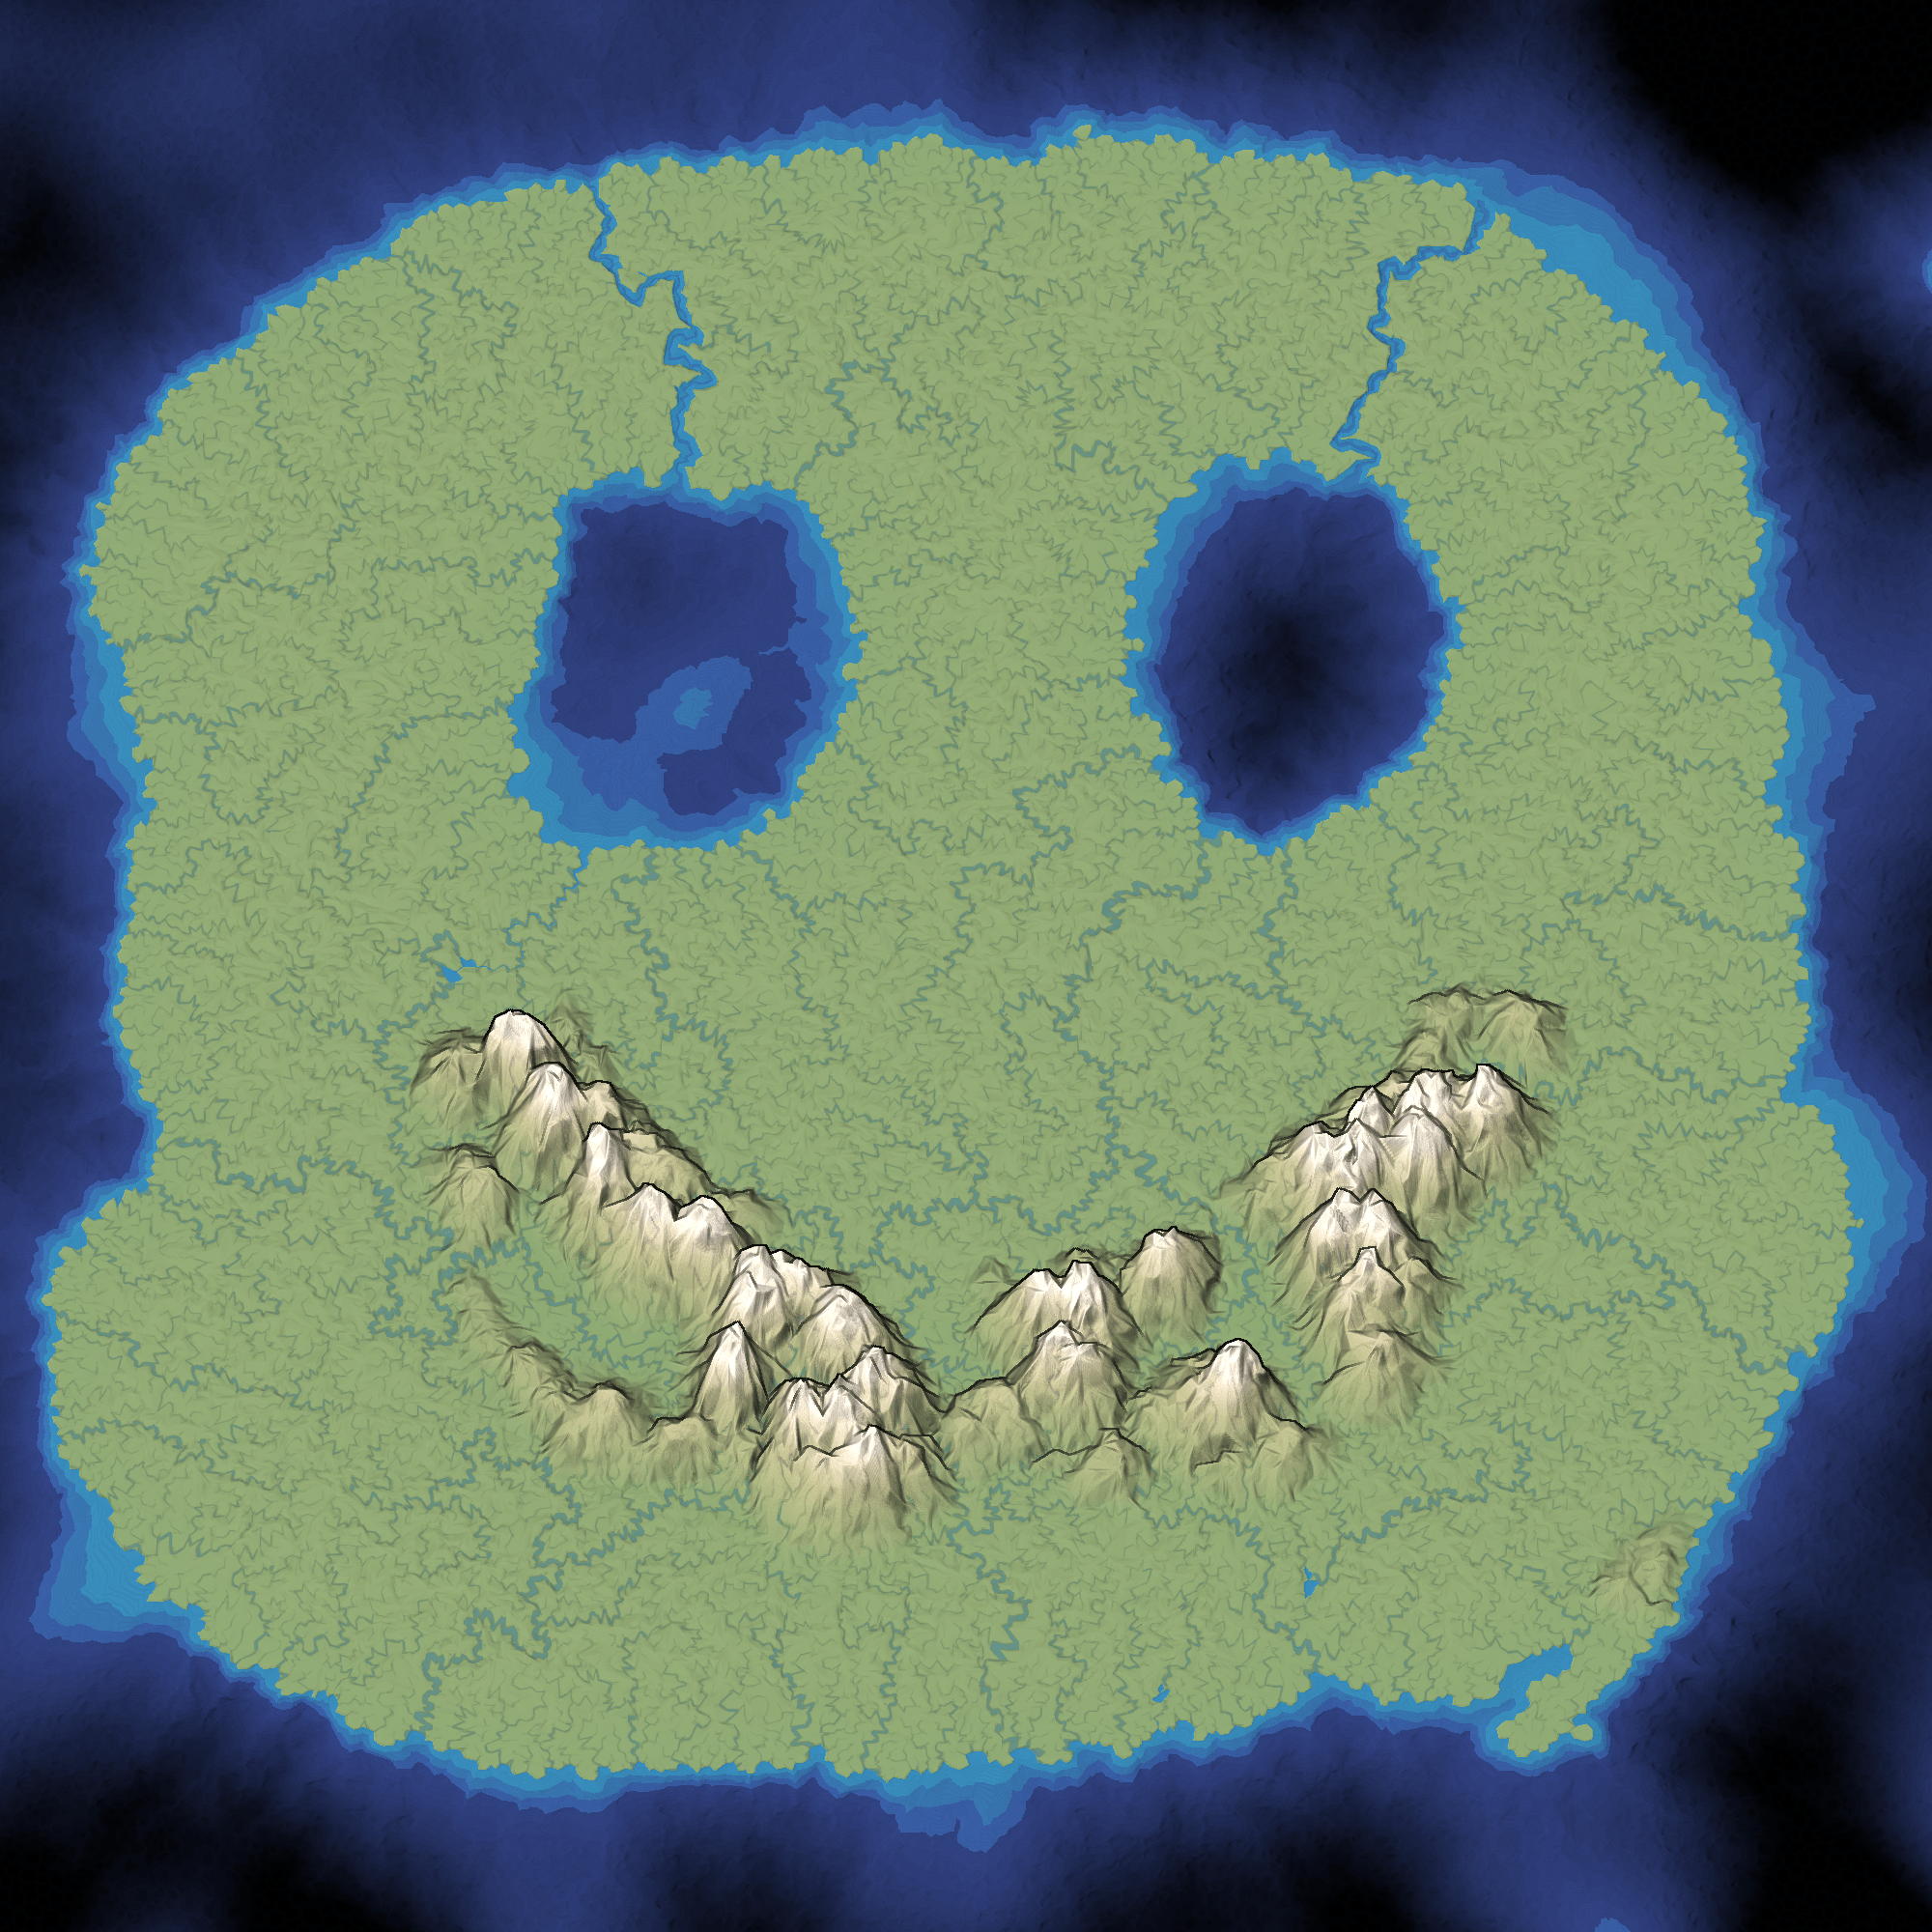
Procedural face generator #
I've had my red blob logo since 1987. I doodle various facial expressions on the blobs, and also experiment with mathematical representations.

Labels: project
Mapgen4: beta #
I put mapgen4 on hold a few weeks ago because I was having some seemingly random unreproducible freezes, where it would still calculate the map updates but it wouldn't draw them. I had tried everything (or so I thought), gotten frustrated, and taken a break. I often find that I need to take a break from something, and then when I get back to it, I figure out the problem. During this break I've been "productively procrastinating", working on several other things that I've wanted to do, including map generation on a sphere, a procedural face generator, improving touch support on many of my pages, and improving my tower defense pathfinding page. I ended up also experimenting with a better interface for my mouse-drag code, a recursive renderer in Vue.js, and a D3 + Vue.js experiment in which Vue keeps track of dependencies for D3.
Labels: mapgen4
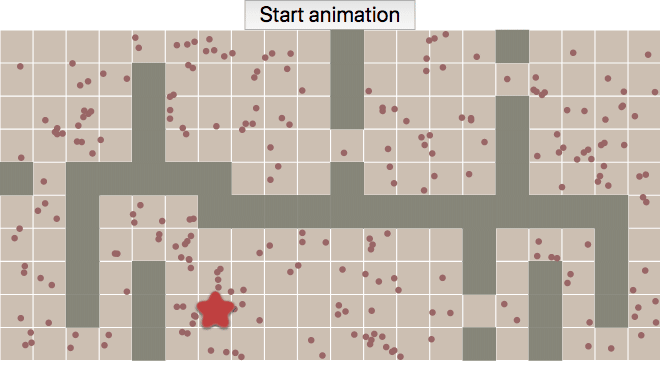
Tower Defense page: distance fields #
One reason I prefer having web pages instead of videos or academic papers is that they're easy to update over time. I'm still updating pages I wrote over 20 years ago.
Yesterday I was reviewing the Tower Defense page (2014) and decided the gap between the diagram at the top:
Labels: making-of , pathfinding
Touch events on the pathfinding pages, part 2 #
I've been avoiding mapgen4 for a few weeks now. I ran into a really annoying bug that frustrated me enough that I wanted to give up. I still need to get back to it, but I'm “productively procrastinating”. Instead of sitting around being frustrated, I'm getting other things done: map generation on a sphere, a procedural face generator, and adding touch event support to my pathfinding pages.
When I wrote the A* tutorial, I didn't consider touch events at all. The traffic I got from mobile/tablet was small. I soon added some touch event handling, but it was incomplete. I figured I'd fix it later. Well, it's been four years now. It's time to fix it finally! (Update: I think my touch event handlers used to work, but I think they stopped working when Chrome 56 and Safari 11.1 changed event handlers to default to passive sometime in late 2017 / early 2018; see this and this)
Labels: making-of
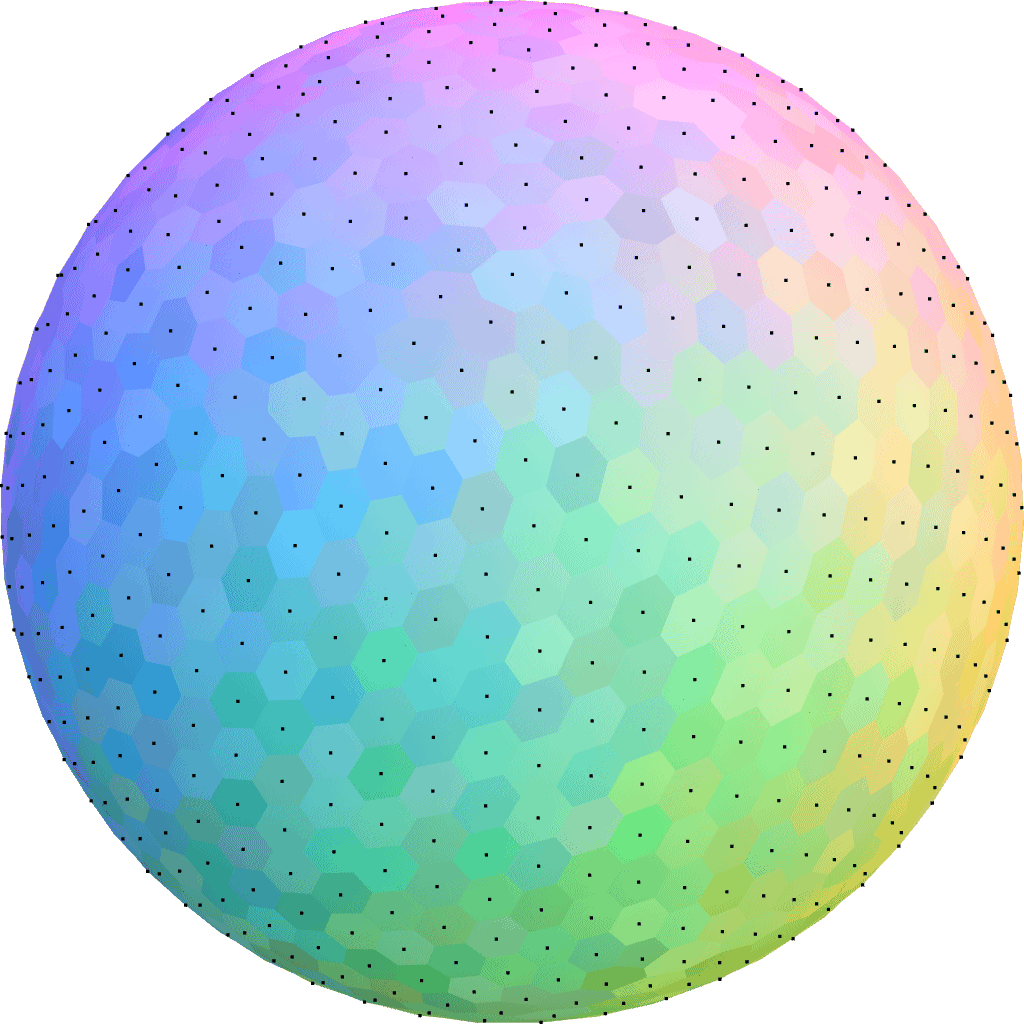
Map generation on a sphere, part 2 #
I spent 9 days working on map generation on a sphere. The first 2 days were geometry: points, triangles, polygons on a sphere. The next 7 days were maps:
- elevation: mapgen4's noise approach looked ok, but I wasn't happy with it, so I switched to using plate tectonics, which looked nice
- moisture: mapgen4's evaporation+wind+rainfall relied too much on a grid, so I wasn't able to use it; I ended up assigning biomes randomly
- rivers: mapgen4's binary tree forest works on graphs, and worked great on a sphere
- rendering: mapgen4's elevation rendering uses outlines and a custom projection which are designed for flat maps, and I wrote a new simple renderer
I wrote up my notes and am going back to working on mapgen4. I'm also putting all the (messy) code up on github.
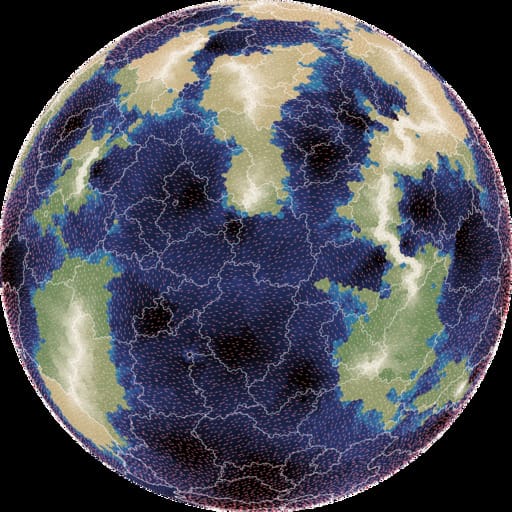
Map generation on a sphere, part 1 #
I ran into a showstopper with mapgen4. It unpredictably "freezes" in the sense that inputs have no effect, even though both the map generation and rendering are running. I'm taking a break from that for ProcGen 2018 - 9 days to work on a procedural generation project.
I decided to play with procedural map generation on a sphere. I've long wanted to try generating entire planets instead of flat maps. See this project and this project to get an idea of what I'm wanting to learn how to do.
Mapgen4: river representation #
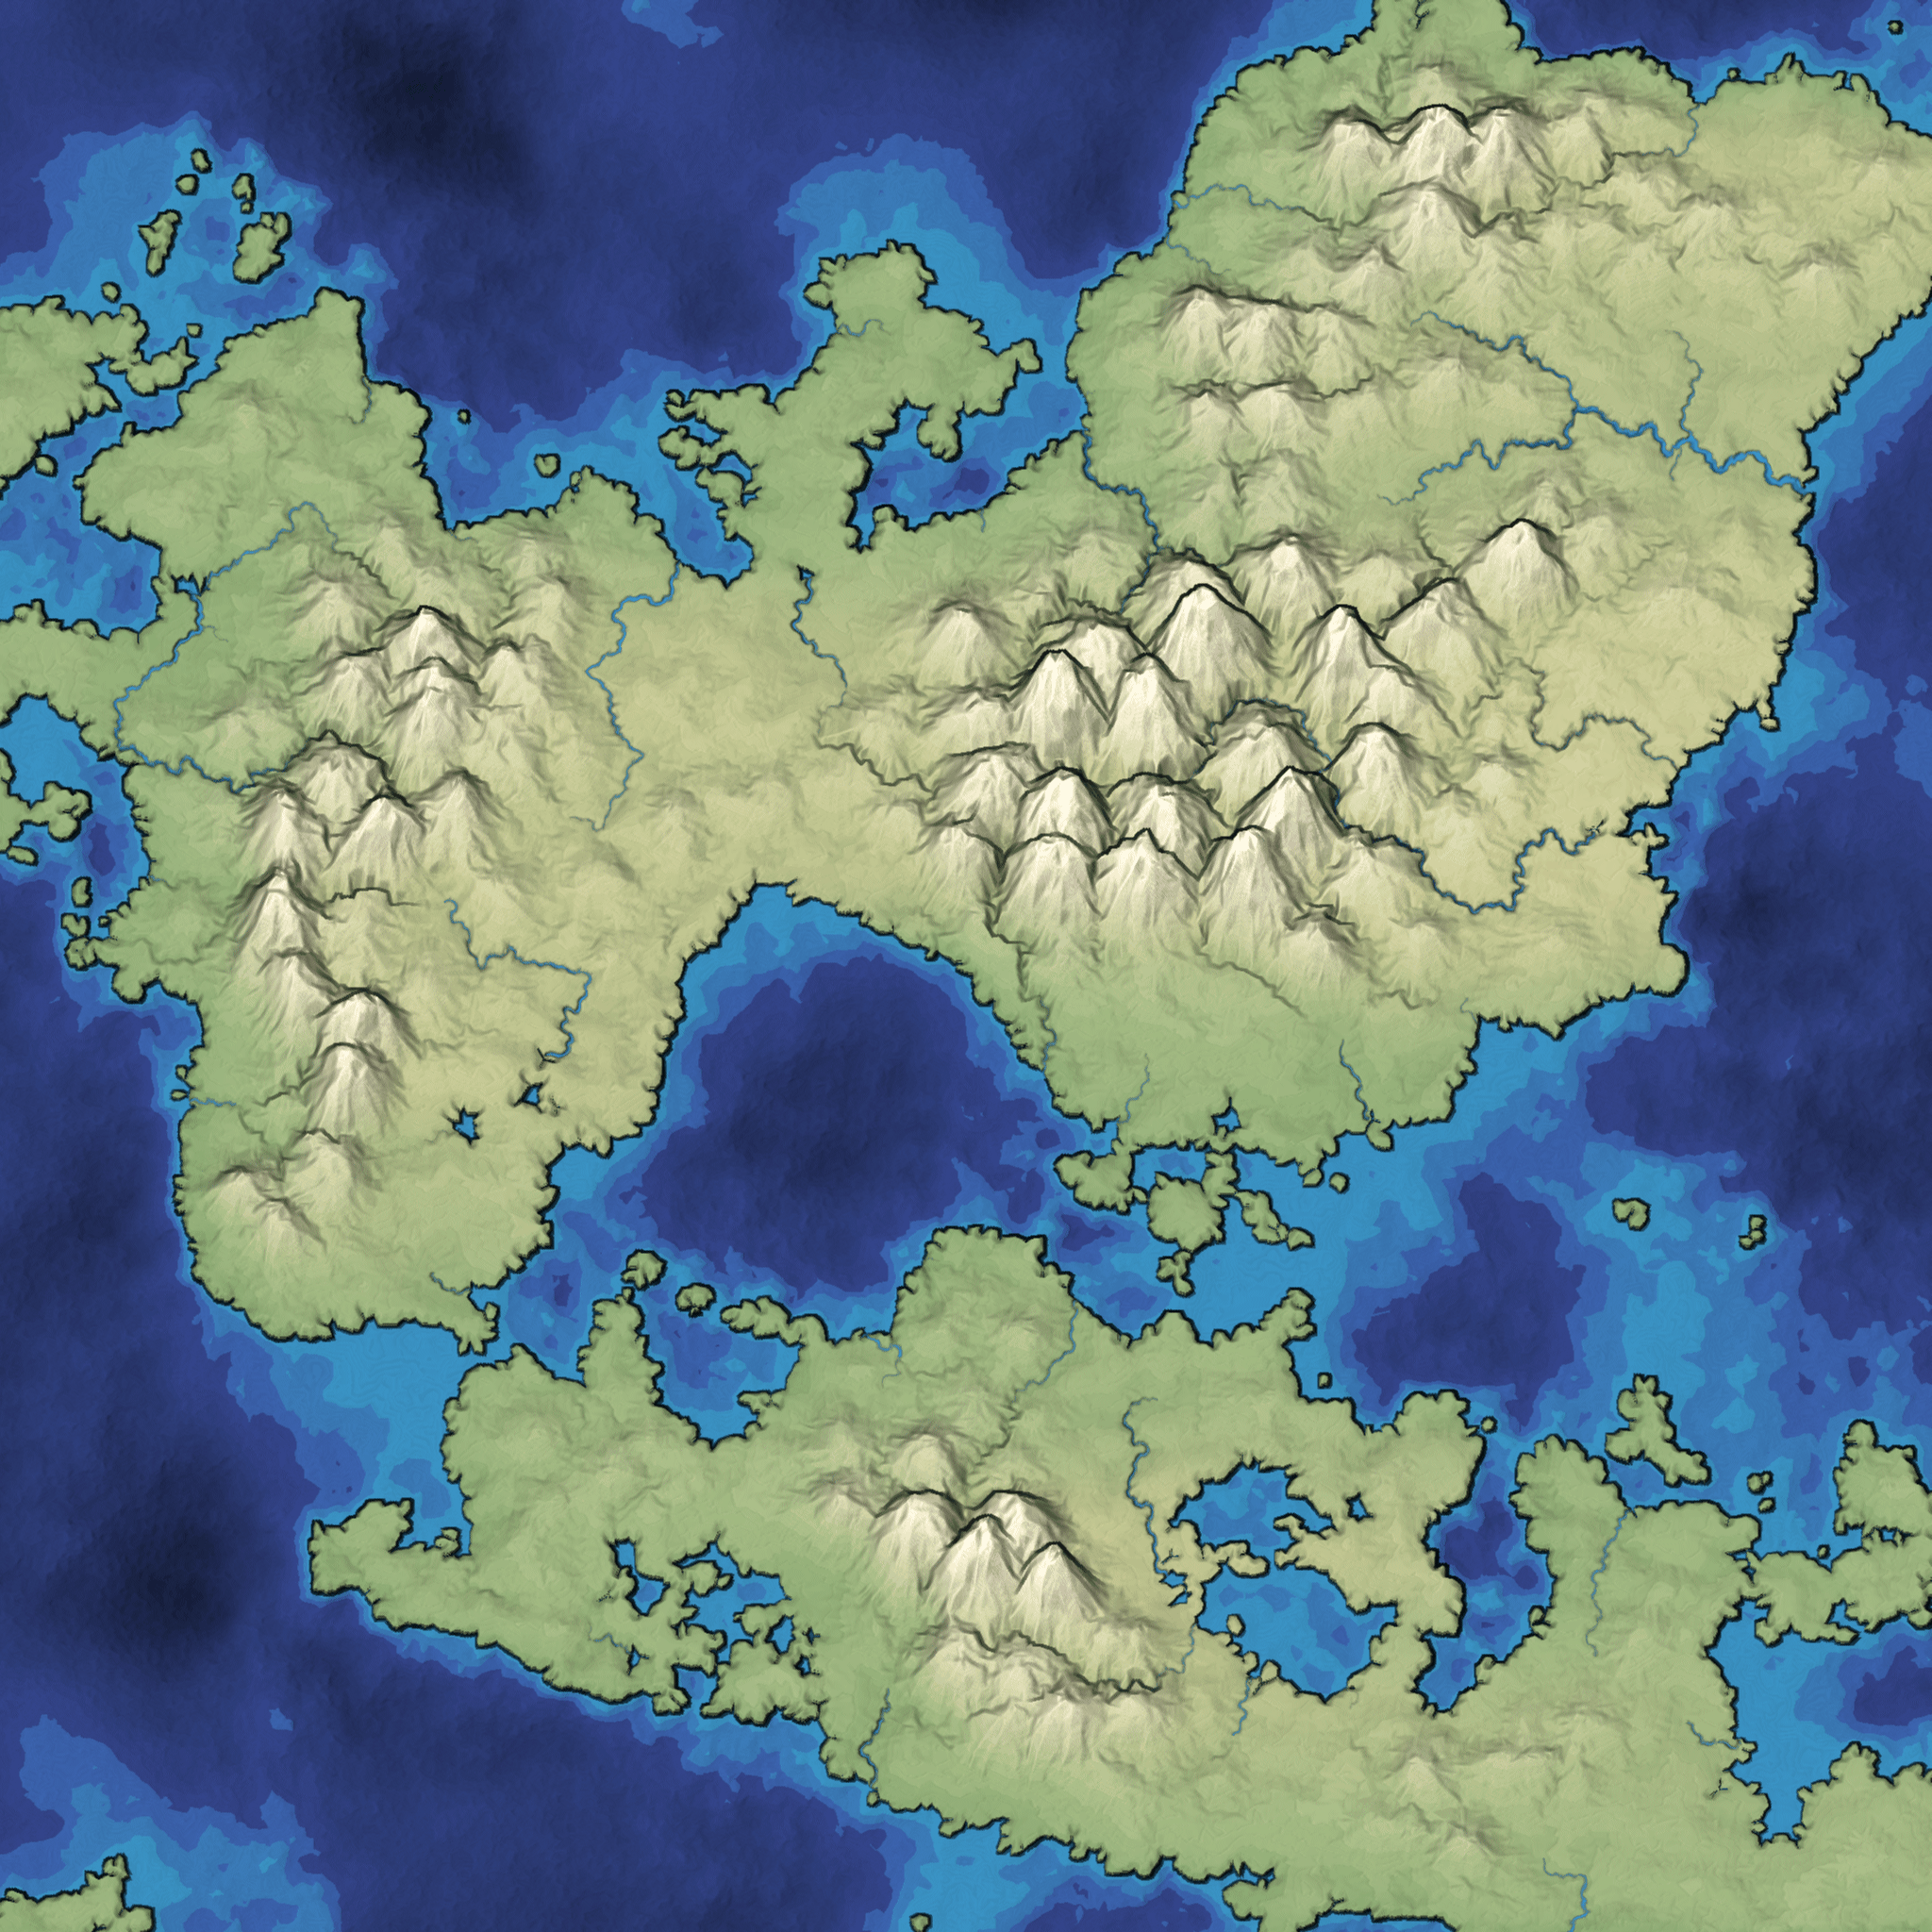
I've reached the point in mapgen4 development when I just want it to be over. So I'm cutting all remaining features and am focusing on finishing. Most of the remaining work isn't interesting enough to blog about so I'm going to describe the river representation I started using last year. It's worked very well for the needs of this project. Take a look at the rivers in this screenshot:
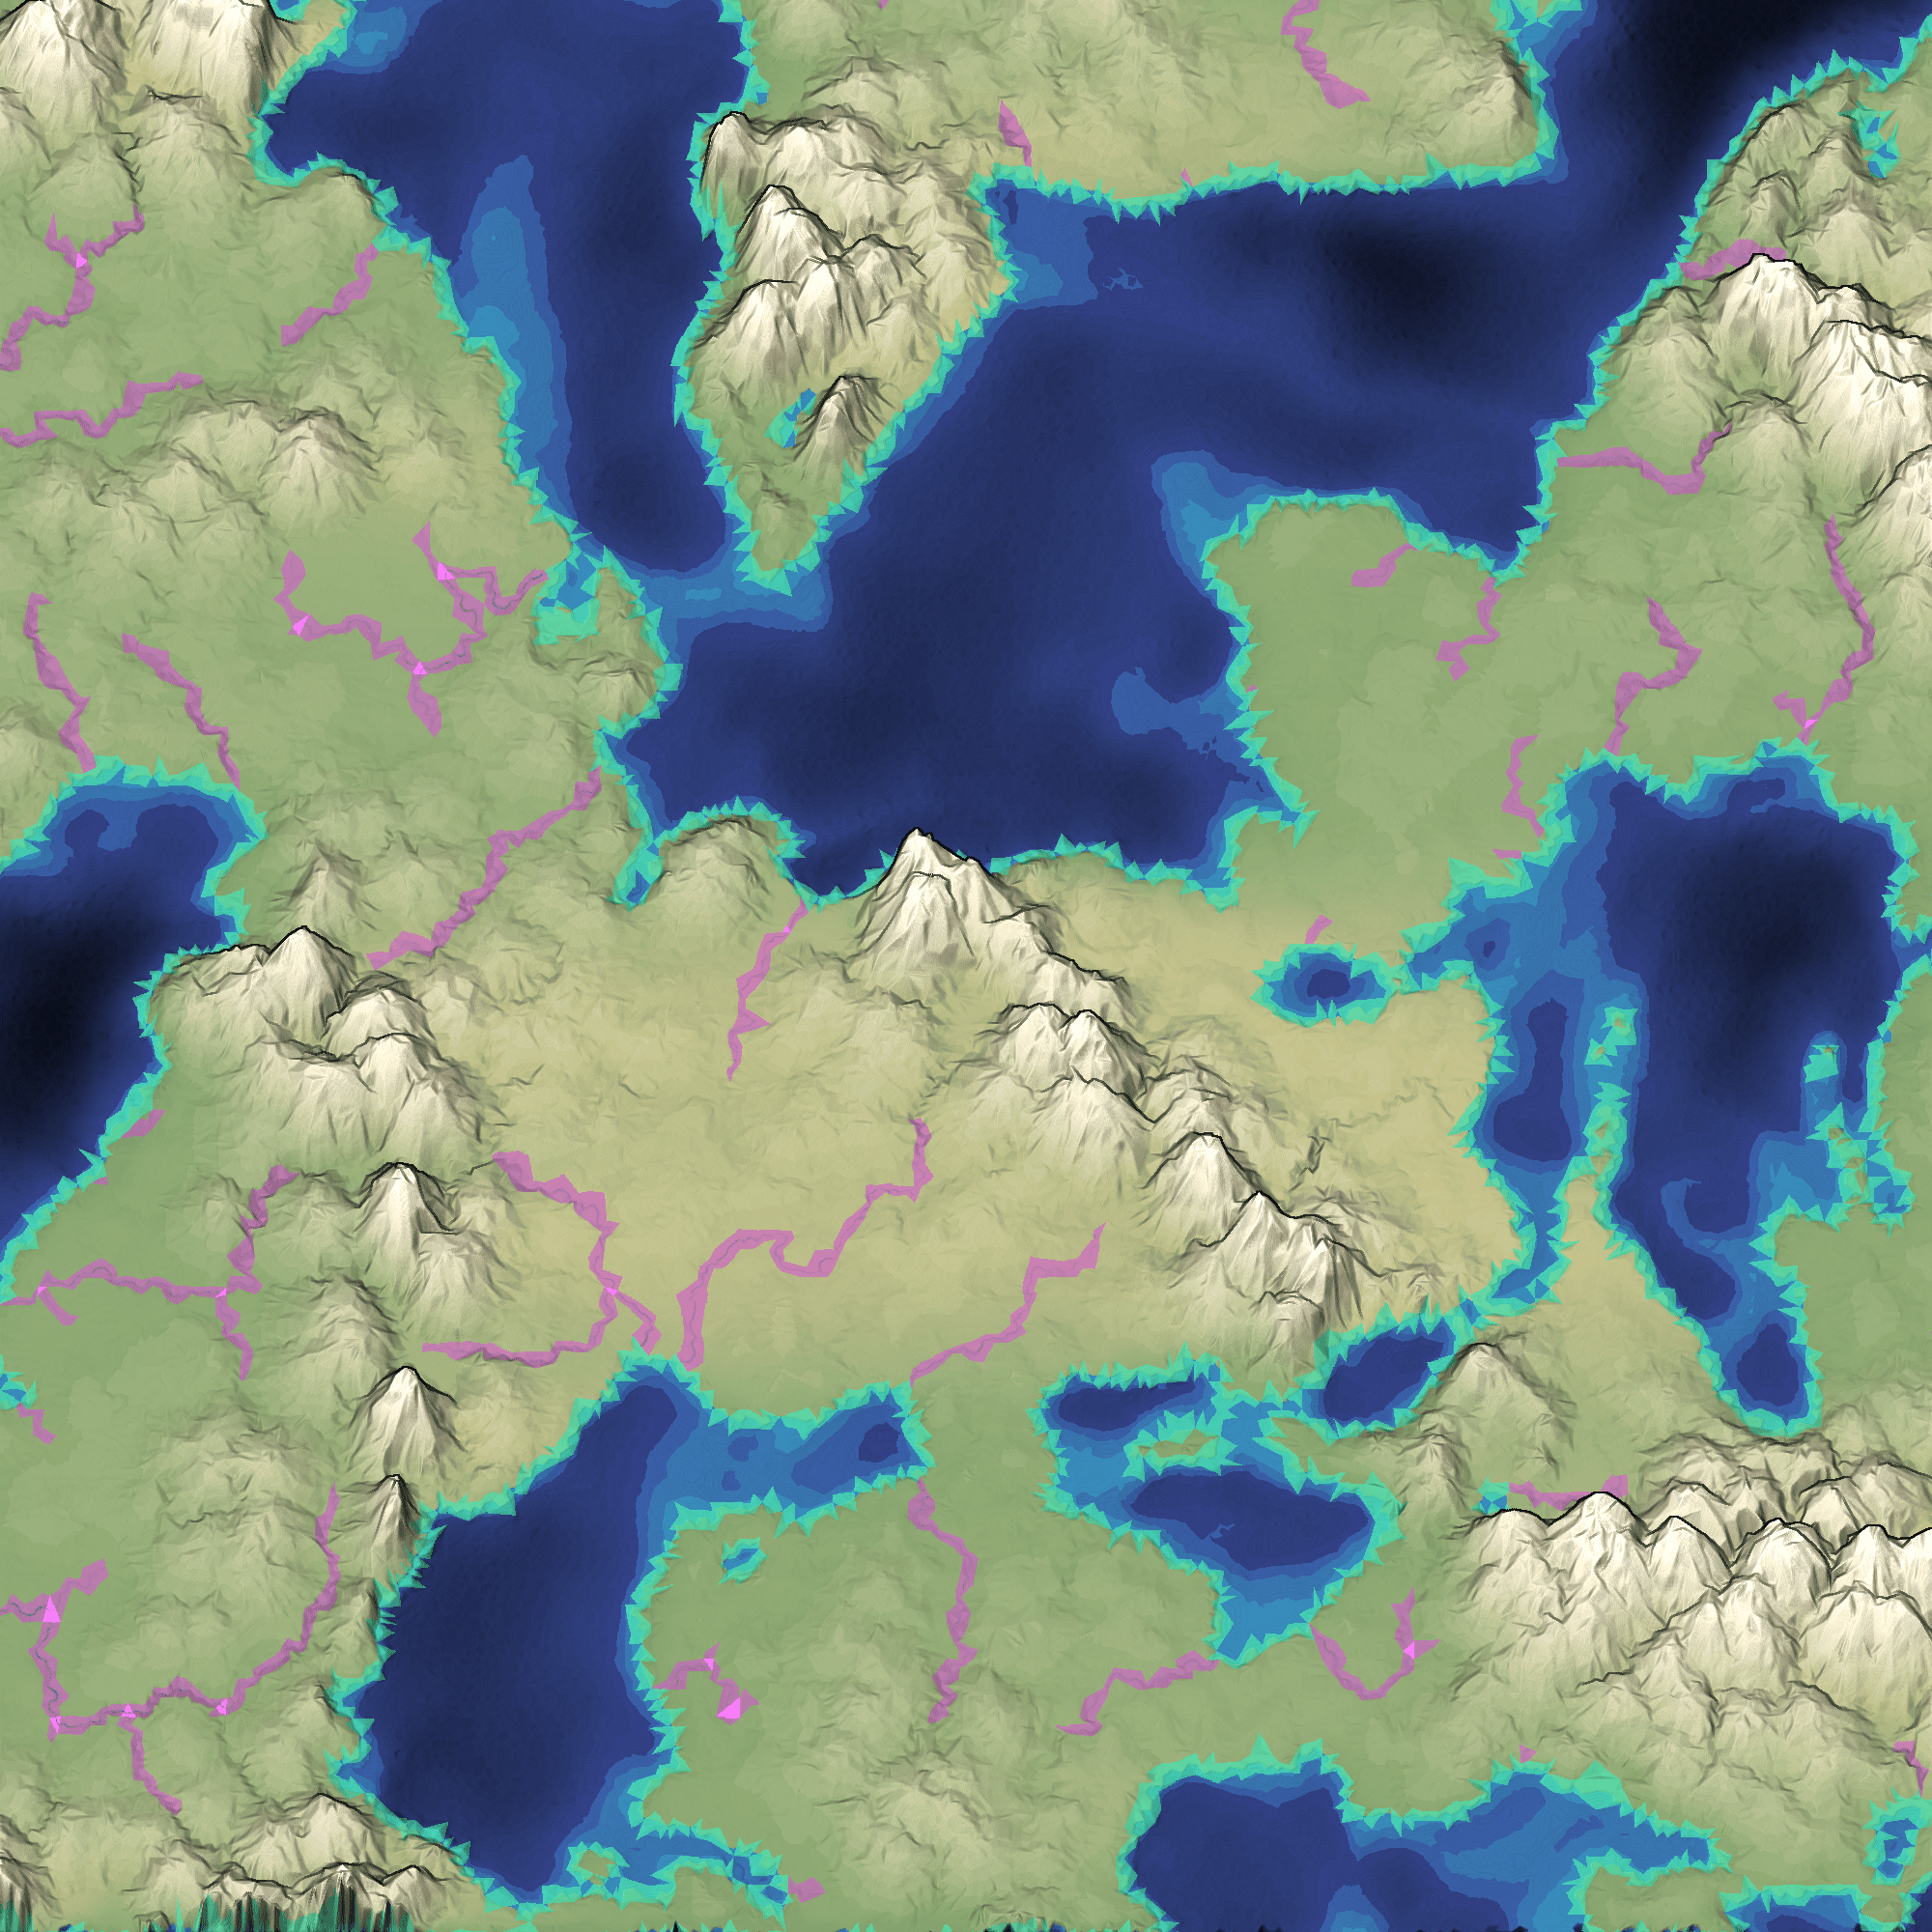
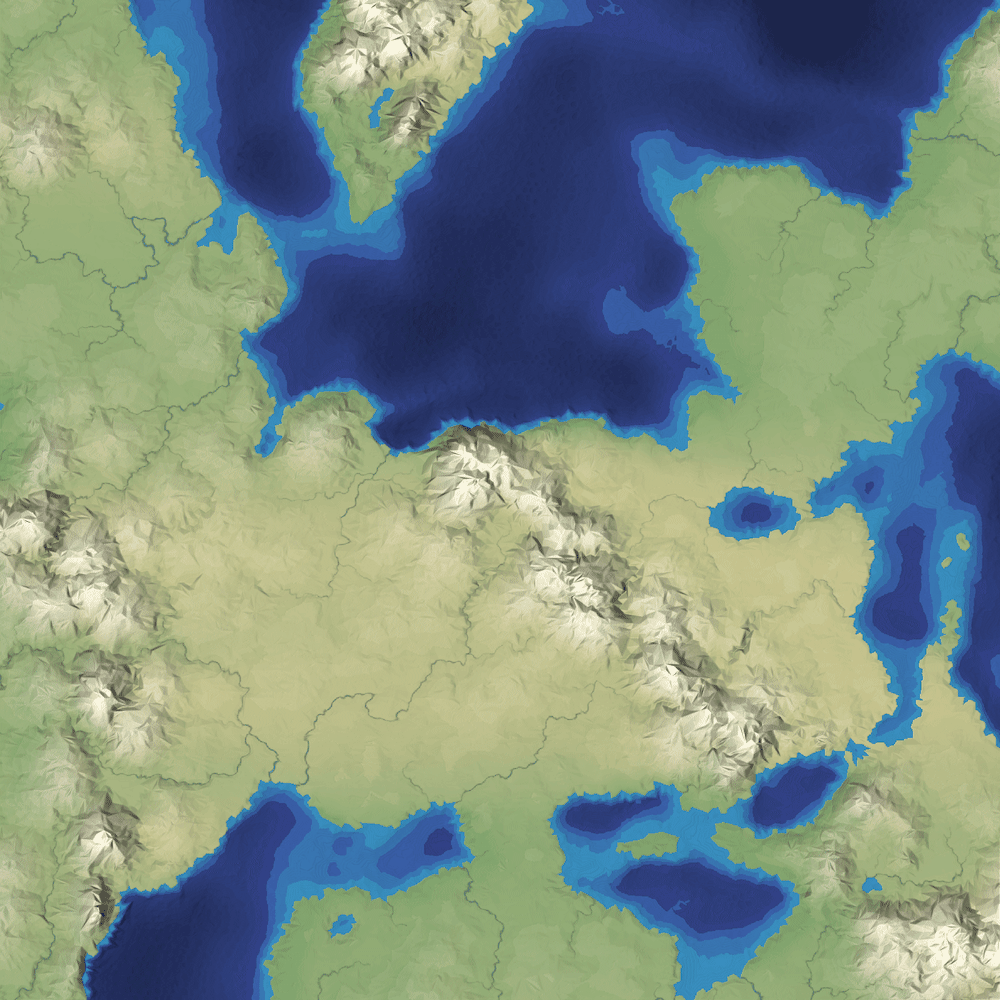
Mapgen4: outlines #
Usually when I make a map generator I focus on the underlying algorithms and data. The data will be used by a game project, so the visuals are meant to be informative and not necessarily pretty. For this project I wanted to make the output pretty. I previously blogged about the unusual projection I'm using for the graphics. It allows you to see the rivers and coastlines top-down but see the mountains from the side. There are two other interesting graphical tricks I'm using to make the maps prettier.
Mapgen4: bug fixes #
The past week has been troubleshooting. The biggest problem was water pouring out of my house's electrical panel, but that's not what this blog post is about. I've been working on bugs in the map generator. There are some bugs I've been putting off because I didn't understand them.
The first problem was that rivers haven't been reaching the ocean. This has been a problem for a while, but I didn't want to fix it until I stopped changing the algorithm. I'm mostly happy with the river algorithm now so I decided to investigate. One thing that the Game AI Summit at GDC emphasizes is building debug visualizations; I'm a fan of that technique and tried it here:
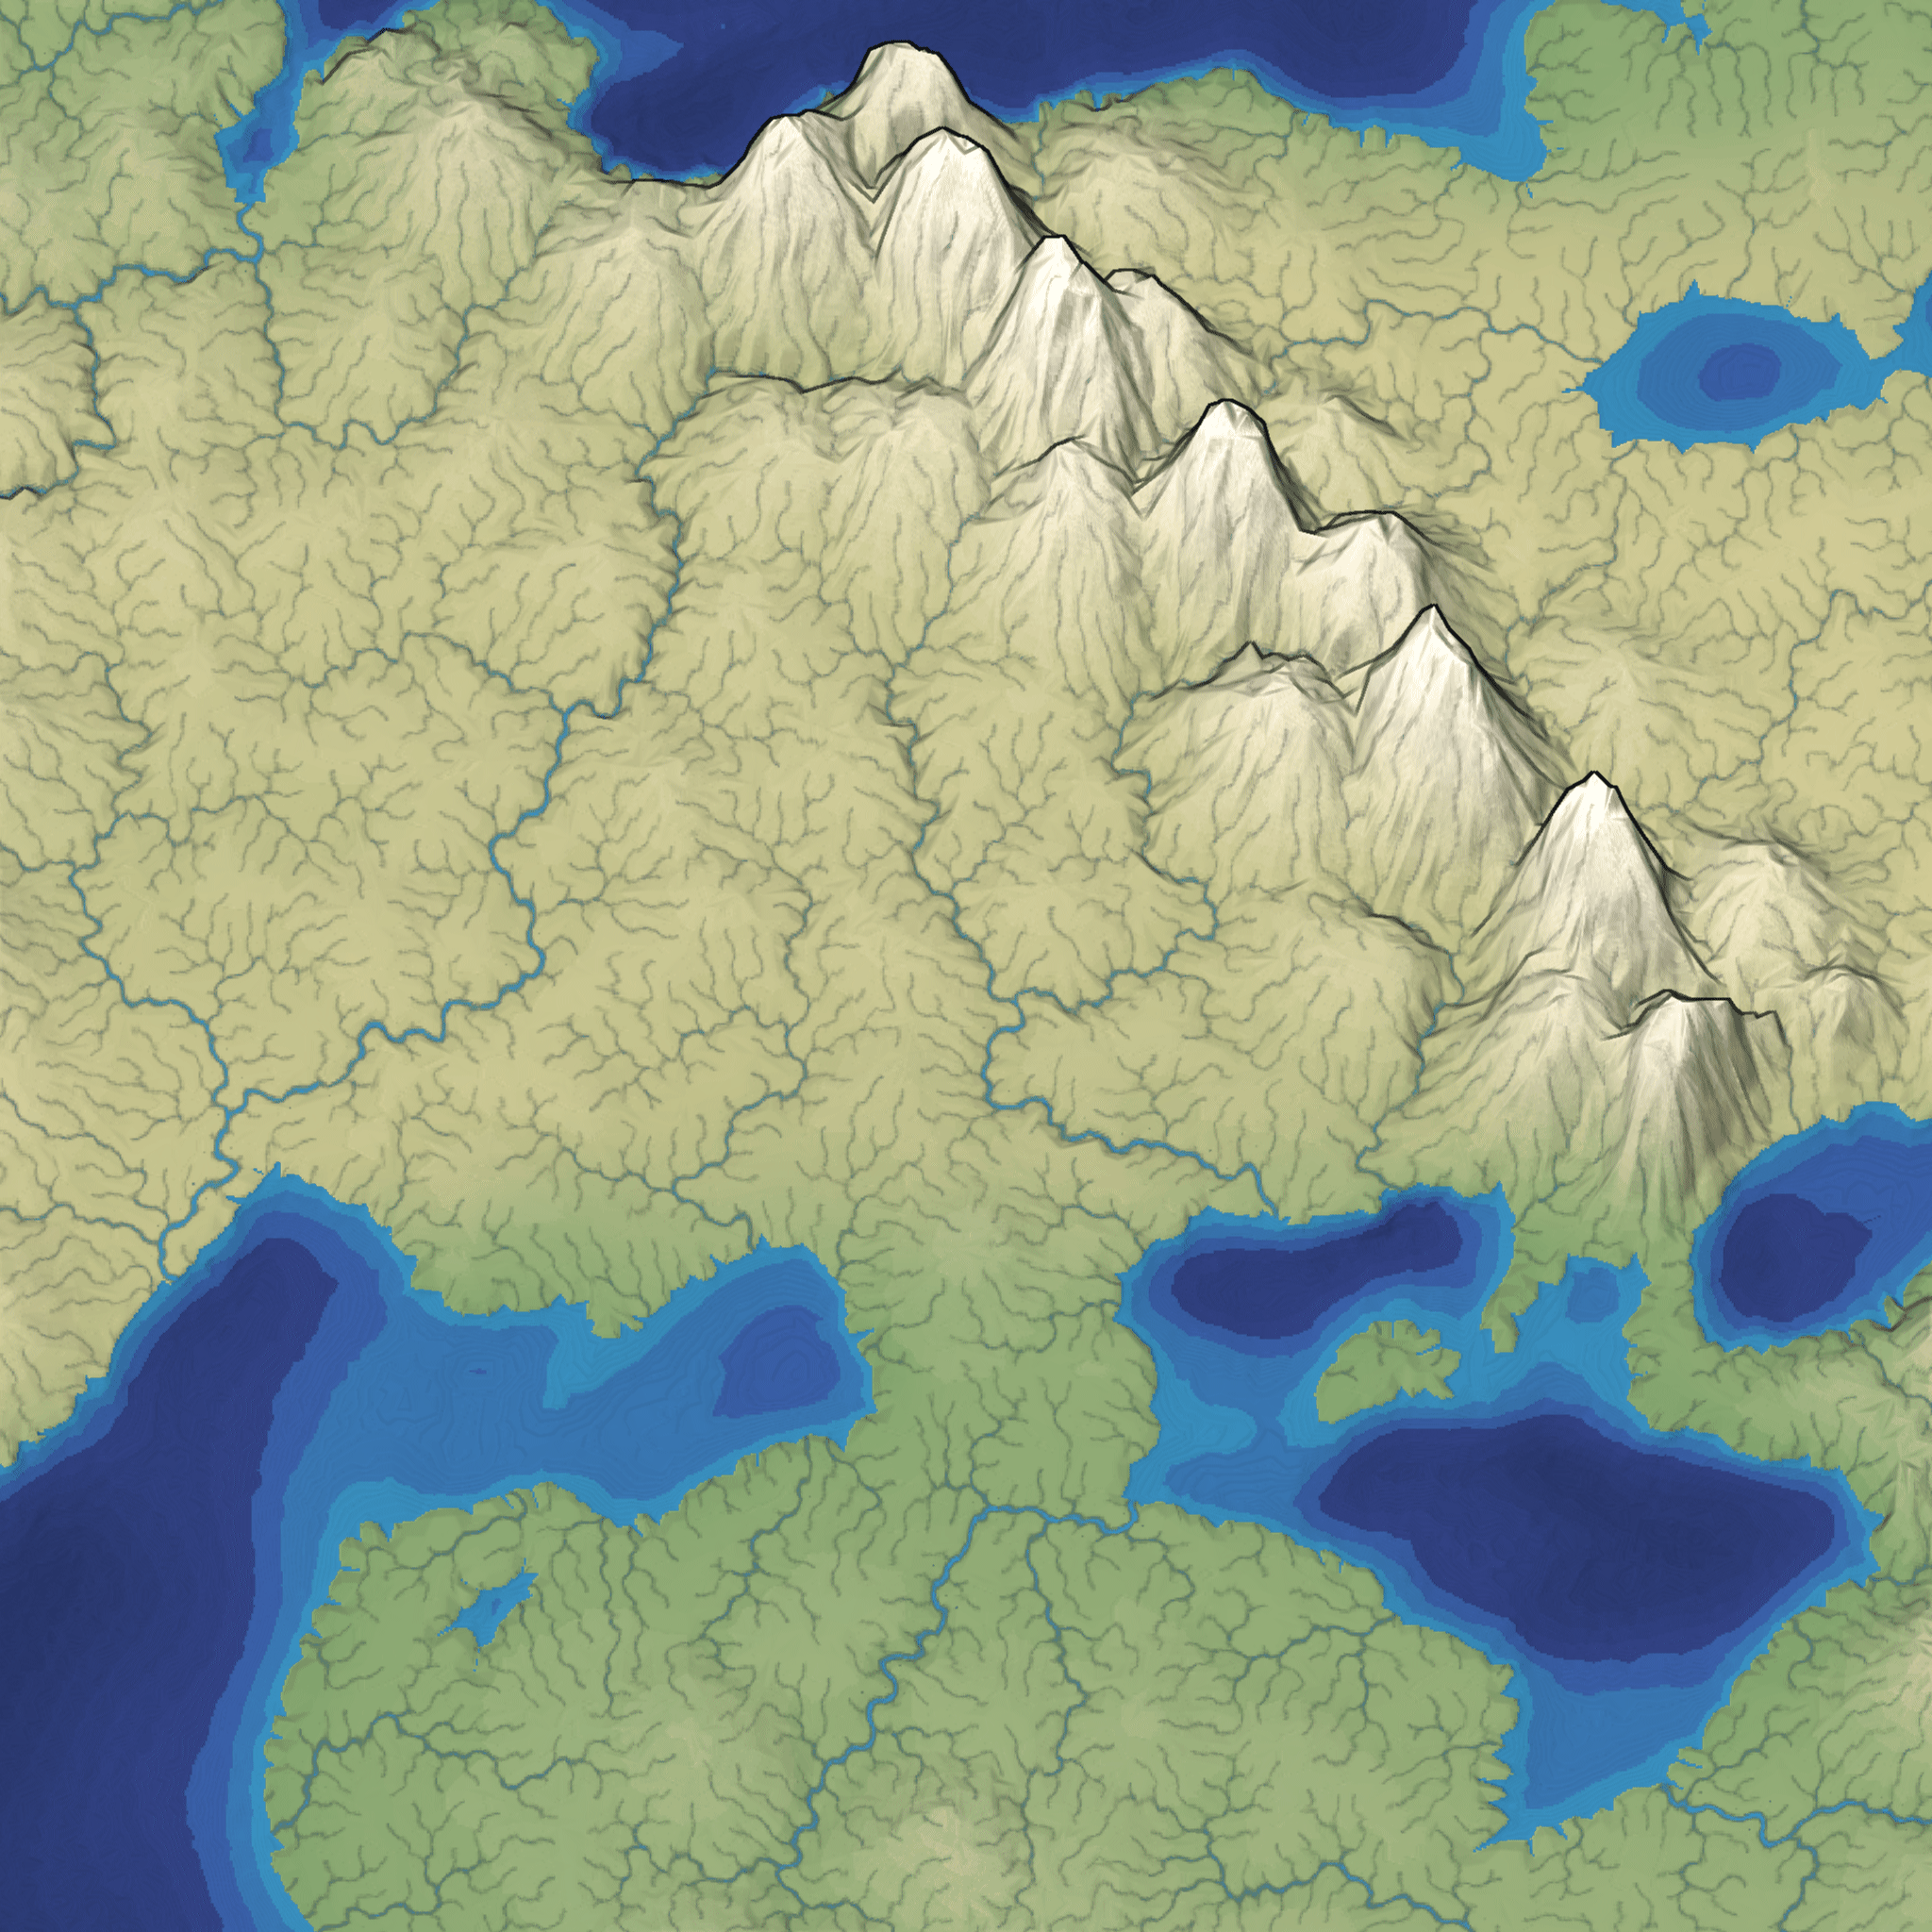
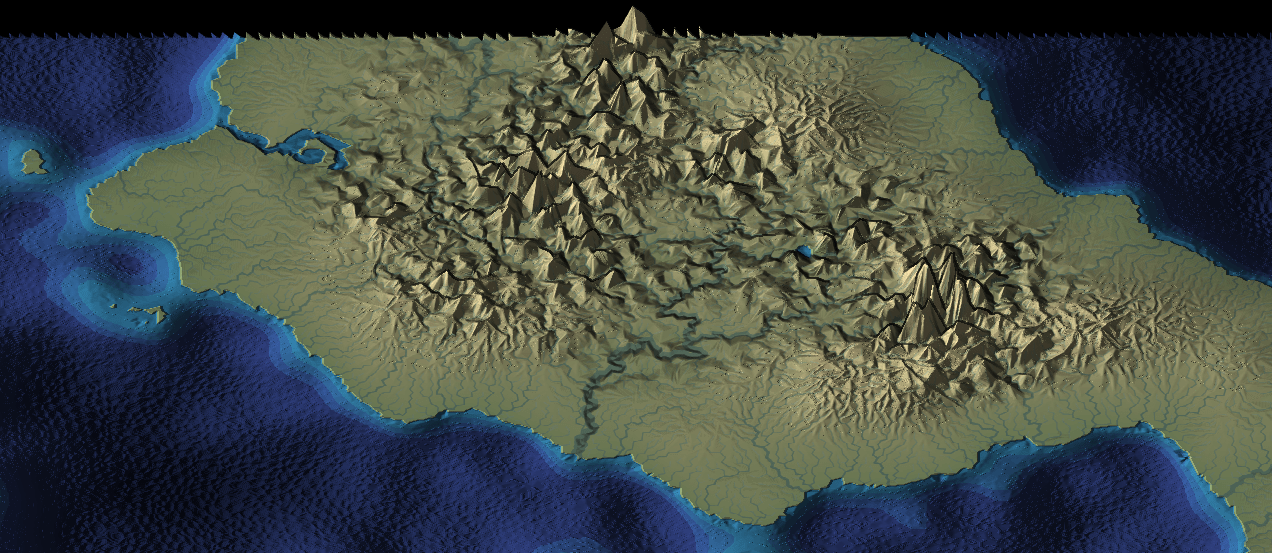
Mapgen4: oblique projection #
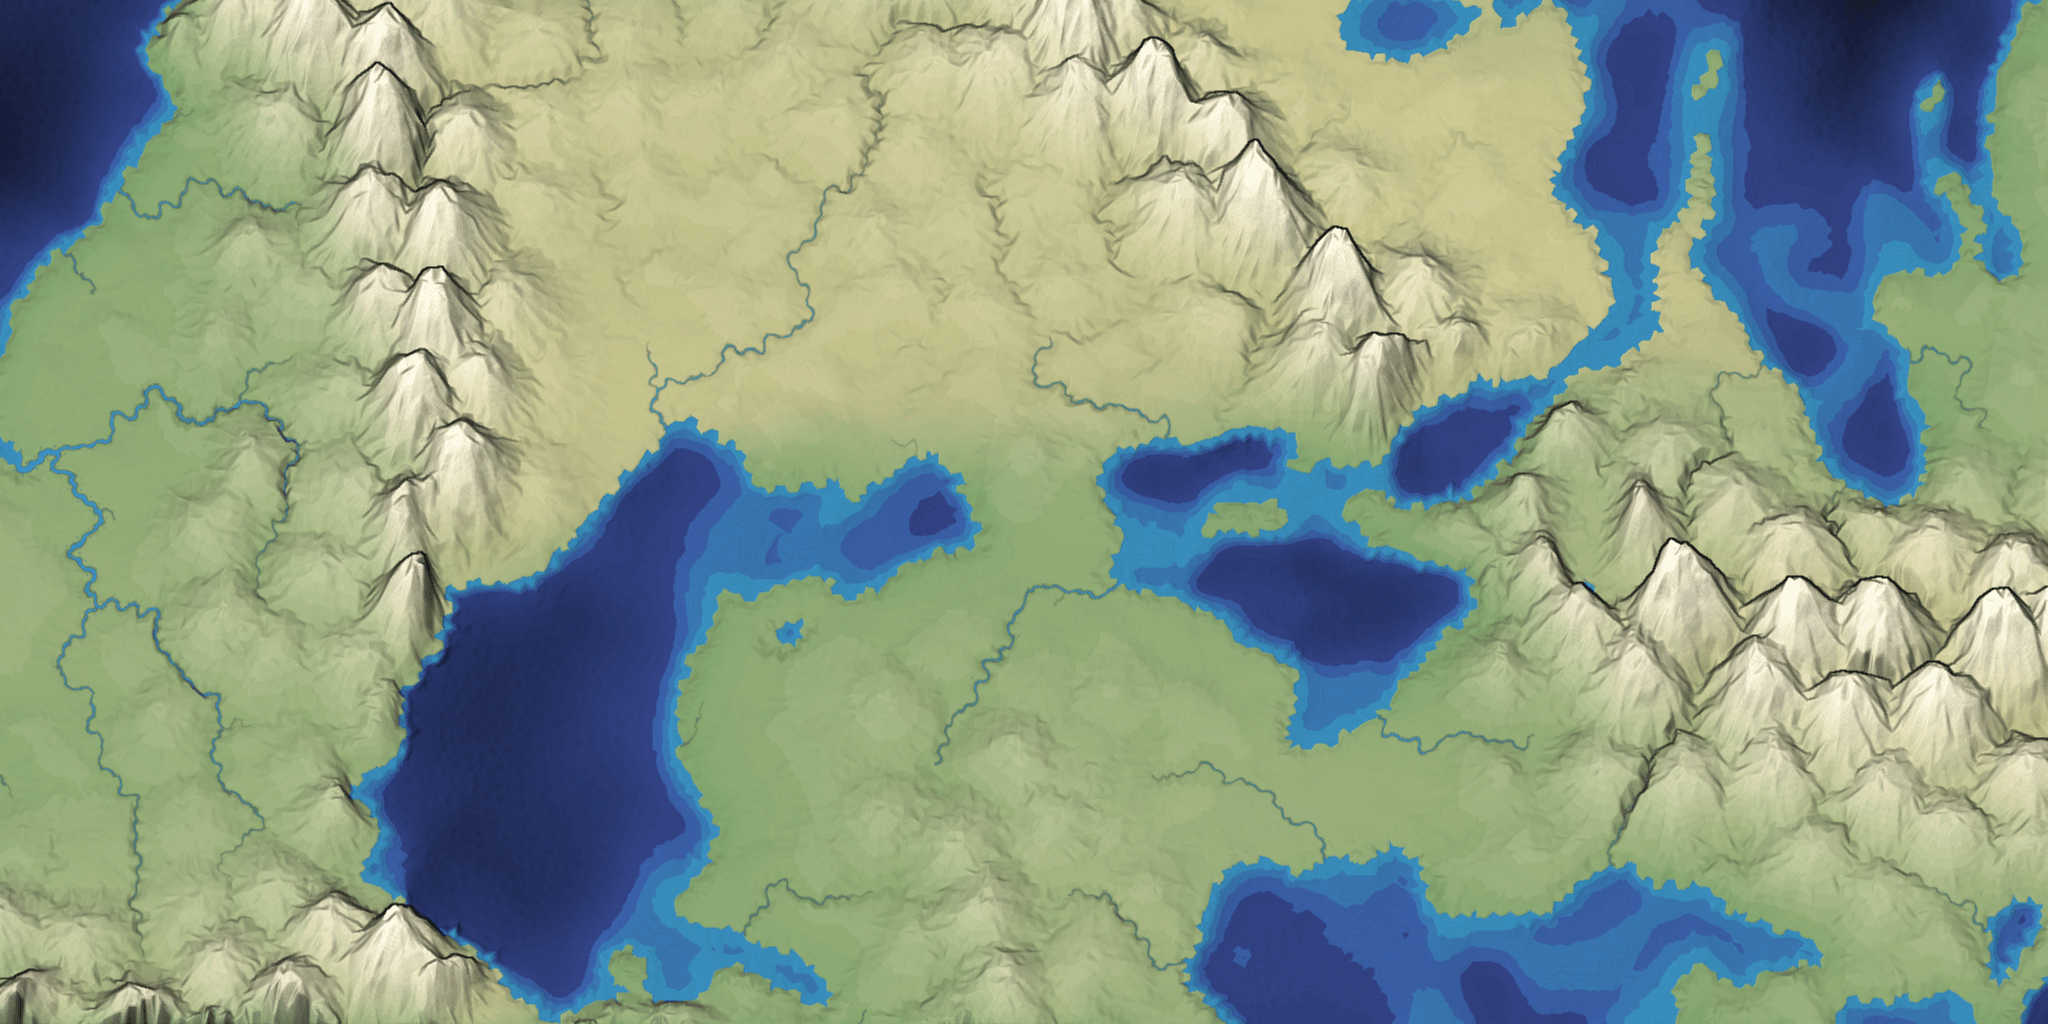
One of my goals for mapgen4 was to explore non-realistic approaches, both to map generation and to map rendering. I wanted to explain the unusual projection I'm using.
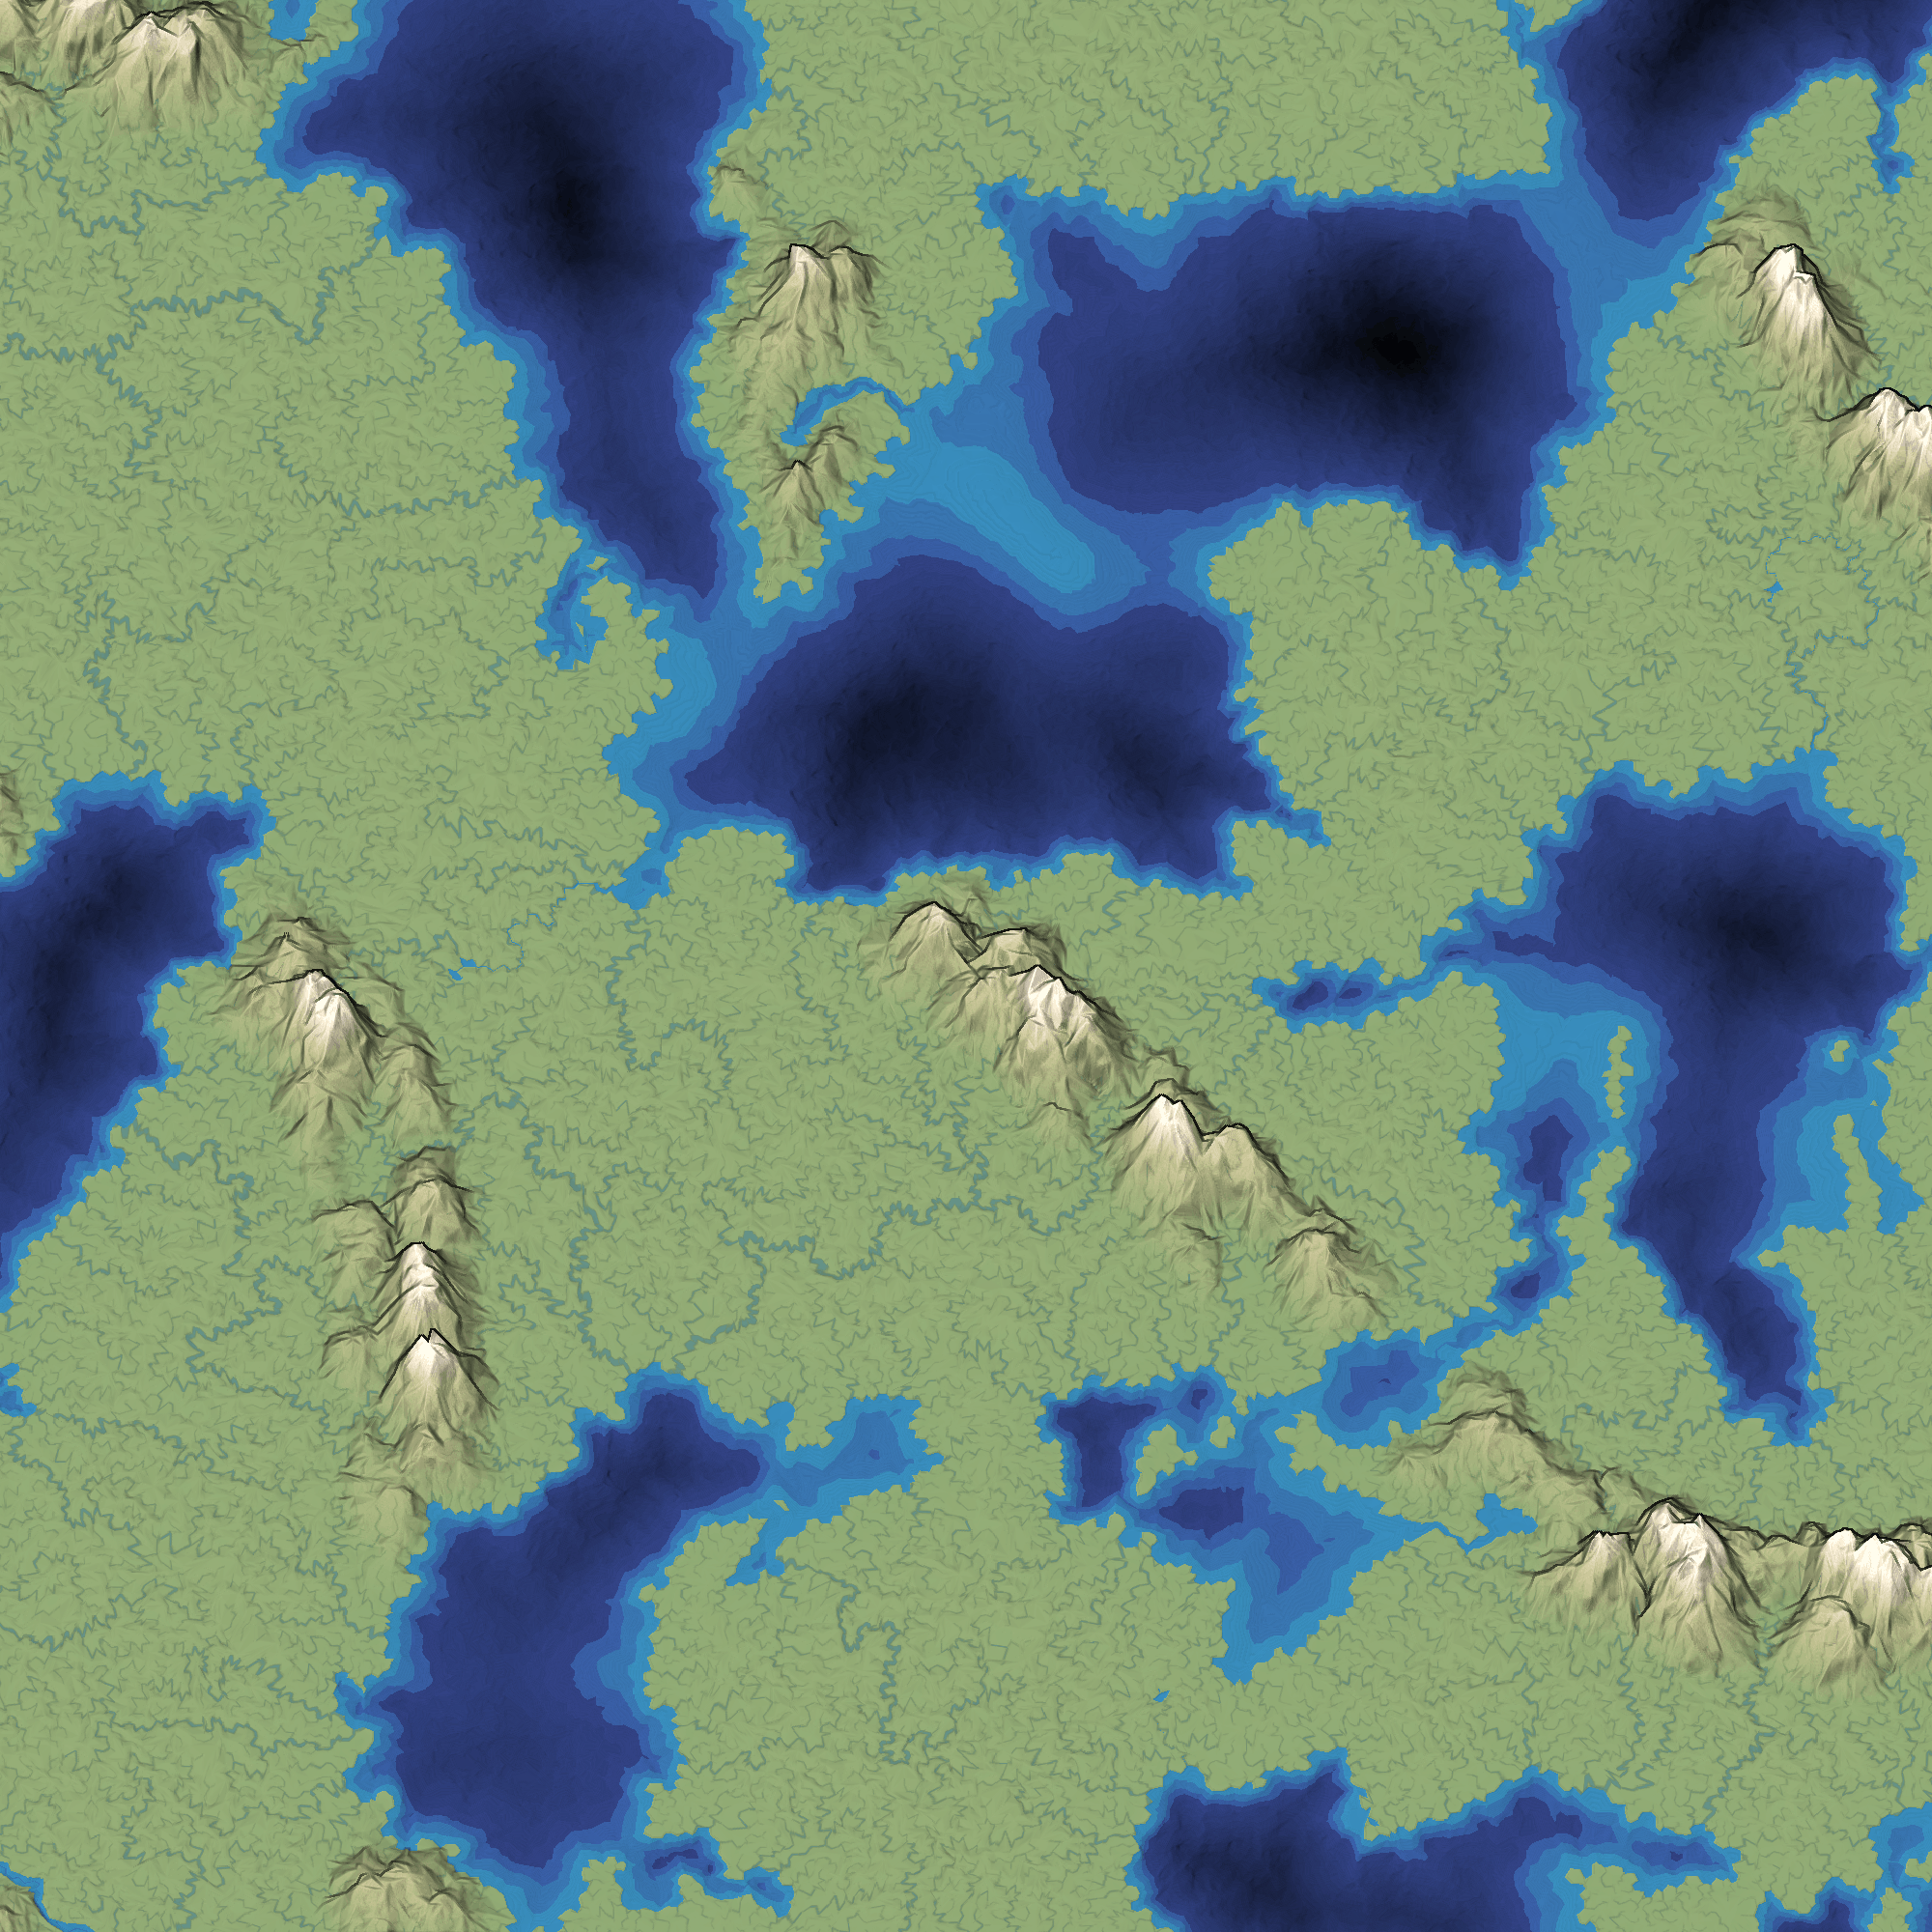
For procedurally generated wilderness maps, it's very common to see a top-down view, often using colors to represent height or biomes:
It's simple to implement, especially in 2D, and it shows the areas of the map, including coastlines and rivers and lakes. You can see where the mountains are, but only because of the color and lighting.
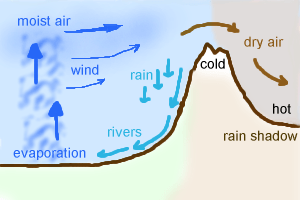
Mapgen4: rainfall #
Last time I rewrote elevation painting. The next thing I wanted to work on was biomes. I'm not actually even sure I need them, but I wanted to try a variant of an approach I had tried in the 1990s and again in 2009:
Mapgen4: elevation painting, revisited #
A few weeks ago I described elevation painting for mapgen4. The idea was to let the user paint areas for mountains, valleys, and oceans, and then use distance fields to interpolate between the areas. After some user testing, I decided to abandon this approach.
When I originally implemented it, I painted mountains and valleys on a minimap. On the main map, I used distance fields to transition between the mountain and valley areas.
Mapgen4: river appearance #
Earlier this week I moved all the heavy computation into its own thread. The rest of the week I wanted to work on rivers. The last time I worked on rivers, I replaced the slow CPU-based renderer with a fast GPU-based renderer. However, the output was ugly:
Mapgen4: threads #
Today I am making mapgen4 multithreaded. I'm trying to blog more often, so I'm putting my notes here instead of keeping them to myself.
Multithreaded Javascript? Yes, with Web Workers. I've known about these for a while but I've never used them until now. The basics:
- Web Workers are more like separate processes rather than threads. They have their own memory. Some browsers support shared memory but it's not something I can count on right now. Introduction and reference.
- Workers can communicate by sending a message to another worker. The message is a data-only object (no functions or resources). Details.
- You can also transfer data to another worker, if it's a contiguous array. This is particularly useful for large arrays of numbers such as WebGL data or, in my case, mapgen4 data including the Voronoi mesh. It avoids a copy.
I find that I learn best by reading a little bit and then playing with something. So I decided to make a simple worker and try it out.
Mapgen4: elevation painting #
Last week I described the plan for elevation in mapgen4. The goal was to allow painting mountains, valleys, and oceans on the map. I used a jittered grid to pick positions for mountain peaks, and then implemented three distance fields:
- Distance from closest mountain peak. I use this to create distinct mountains instead of noise-based continuous mountains.
- Distance from coastline. On the ocean side, I use this to make shallow water near the coast. On the land side, I use this to keep mountains away from coasts. (not sure I should)
- Distance from mountain ranges. I use this to make a gradual drop from mountains to valleys.
I continued optimizing. The main map regeneration is now around 400ms for the one-time initialization and 120ms to regenerate the map while painting. I implemented a simple paint interface, with small/medium/large brushes and ocean/valley/mountain tools. It works on touch devices too, and it feels pretty good on a tablet.
Mapgen4: elevation #
Last week I posted about mapgen4, the procedural map generation project I'm working on this summer. I had been trying to limit the scope of the project, and also shifting my thinking from maps for a game to maps that look pretty. I've been spending a lot of time optimizing and restructuring the code for this. It occurred to me that I'm approaching elevation all wrong.
Mapgen4: goals #
I've been posting on Twitter but was reminded that I should be posting more to my blog. I don't want Twitter to be the only place to read about what I'm doing.
Back in 2010 I had written an influential article about map generation, making maps specifically designed for one game. I made a Flash demo called mapgen2. At the time I didn't emphasize enough how each of the layers of the process could be different. Many people took the recipe as the way to do it, even though the recipe was specifically for the needs of that one game. In mapgen2 the rivers depended on elevation which depended on coastlines. But it could've been coastlines depended on elevation which depended on rivers. There are lots of different ways to glue the pieces together. In 2017, I wanted to go back and try a different recipe with the same ingredients (Voronoi, elevation, rivers, biomes, etc.). For a while I thought the new project, mapgen4, will do all the things! I experimented with lots of things but the task seemed overwhelming. I decided to step back and limit my scope. I rebuilt the same algorithms with the new framework (HTML5, and more efficient data structures), and launched that as an HTML5 version of mapgen2. Then I put everything on hold.
Delaunator guide #
I decided that I should work on a new tutorial this summer. What better than to take all the map experiments I worked on last summer, and turn them into a procedural voronoi-map generation tutorial? As I worked on the outline and some of the initial diagrams I realized this was going to be big: poisson disc, delaunay, voronoi, elevation, climate, biomes, oceans, rivers, towns, roads, natural resourcess, and so much more. And starting with something big often leads to failure. So I needed something smaller.
I decided that I should start with just the structural part: Delaunay and Voronoi, and how they can be used for game maps: poisson disc, jitted grid, delaunay, voronoi, graph properties, neighbors, traversal, lookups, iterators, ghost elements, centroid vs incenter vs circumcenter, rounded regions, subdivision, and more. While working on the outline for this I realized again that it was going to be big. And starting with something big often leads to failure. So I needed something even smaller.
Modifying spelling #
Back in 2016 I started a mini-project to play with neural networks. I concluded that the approach I used didn't give me enough control over the procedural generation. I wanted to revisit the project and focus on word manipulation (the problem I wanted to solve) instead of neural networks (the tool I was learning). Over the past week I read a lot, played with some code, and learned more about English. I tried modifying the spelling of existing words. Example:
Four skore and seven yirz ago our fatherz brougt forth on this kontinent, a noo nation, konceived in Liberty, and dedikated too the propozition that all men are kreated ekual.
I wrote up the results, including an interactive demo and instructions for compiling and using the software and dataset I found. I don't know what I will do with this, but it was interesting and I hope it's useful to someone.
Thoughts on explorable explanations #
Conversations with several people over the past few months have led me to wonder about the purpose of the interactive diagrams in my articles. I see lots of interactive diagrams but most are not integrated into text. The interactive diagrams are cool. They make me feel like a pioneer exploring a new medium. They're exciting! I like making them! But … that doesn't mean I should be making them.
April updates: hex grid guide, load time #
The past 7 weeks I've been working on my guide to hexagonal grids. Over the years I accumulated a long list of TO DO items on my Trello page, and I finally went through that list and implemented lots of them. Two blog posts ago I described rewriting it from an imperative style to a declarative style, and switching from manual to automatic dependency tracking. In the last blog post I described many of the improvements I made to the diagrams, including several new ones.
As I've added to the page over the years, it's become slower and slower. The main problem is the page loading time. The HTML loads, then the Javascript loads, then the Javascript runs to create the diagrams, sample code, and some of the text of the page. If you follow a link to a specific section, the browser jumps to that section, but then the layout changes as more content is added to the page by the Javascript. This is an unpleasant experience.
Labels: making-of
April updates: hex grid guide, iteration #
One of my goals this year is to iterate more. I have a tendency to "launch" a page and then move on to the next topic. Instead, for the first few months of the year I decided I would go through my existing pages to:
- figure out how the content could be better (explanations, diagrams, user interface, little details)
- figure out how the tech could be better (load time, animation code, diagramming code, code structure)
Over the past 6 weeks I've been working on my guide to hexagonal grids. I first worked on the tech, switching from an imperative style to a declarative style, and also switching to a library with automatic dependency tracking. Then I worked on content updates, some of which I described in my previous blog post. In the past week I've been going through my list on trello and implementing more content updates:
April updates: hex grid guide #
“We can rebuild it—we have the technology.”
Over the past few weeks I've been reimplementing my guide to hexagonal grids. I'm generally not a fan of rewrites that have no end-user benefits but there are lots of improvements I want to make to the page, and the convoluted code was making it harder to make the changes I wanted. I ended up spending 60 hours on this, reduced the number of lines of code from 2400 to 1400, and reduced the total Javascript sent to the browser (gzipped) from 85k to 54k. A large part of this was rewriting the diagrams to use Vue.js instead of D3.js. As much as I love D3, there's not much on the hexagon guide that benefits from it, and I ended up using it as a nicer JQuery. In a previous blog post I described wanting dependency tracking. That's why Vue.js worked well for this page. I think React would've been a reasonable choice as well, but on this page Vue fit my needs better.
March updates: lots of small things #
One of my goals this year is to publish in smaller chunks instead of trying to do everything in "one big launch". This is what I've been working on over the past few weeks:
Using Vue with Canvas #
In my last post I had said I was trying out some libraries to automatically track dependencies for me. The one I'm playing with right now is Vue.js. It can track dependencies between data and the HTML/SVG elements. For example if I write SVG:
<circle :cx="center.x" :cy="center.y" r="30"/>
and I have it hooked up to data:
data: {
  center: {x: 100, y: 150}
}
then Vue will remember that the circle depends on those x and y properties. If I modify the data with center.x = 75; Vue will detect this and update the circle. This is quite convenient!
How I implement my interactive diagrams, part 2 #
In the last post I described how I structure my interactive diagrams and gave some examples. In this post I'll describe what I'd like to do for future diagrams.
When I started writing interactive diagrams I used d3.js, which is a great visualization toolkit. At the time I thought data visualization was the hardest part of what I was doing, and I needed a library for that. Since then, I've seen other libraries — React, Riot, Ember, Mithril, Intercooler, Marko, Vue, Aurelia, Ractive, Rax, Svelte, MobX, Moon, Dio, Etch, Hyperapp, S/Surplus, Preact, Polymer, lit-html, Elm, and many more — that have given me different ways to look at the problem. I've realized that the visualization isn't the hardest part of what I'm trying to do. There are two two big problems I want a library to help me with:
- How do I update the visualization?
- Which algorithms do I need to run again?
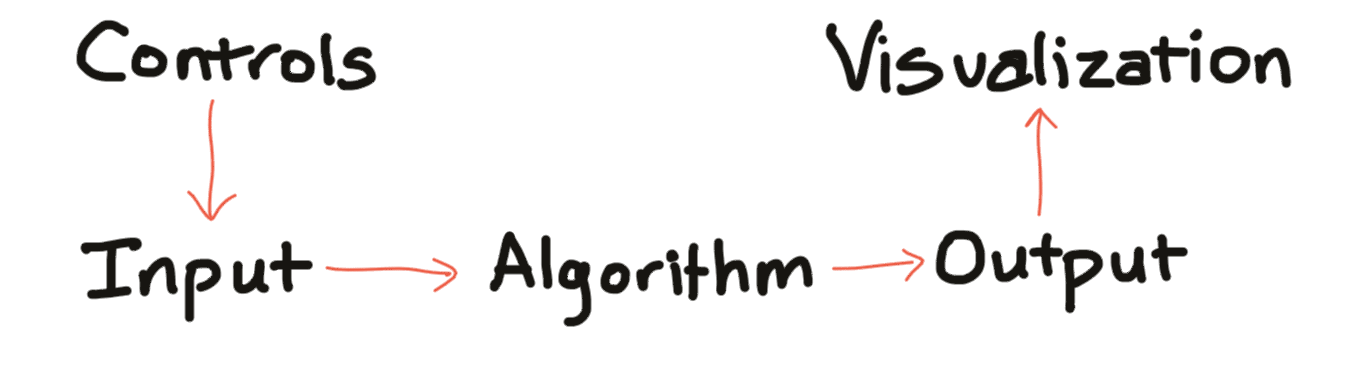
How I implement my interactive diagrams, part 1 #
I have an interactive tutorial about making interactive tutorials, showing how I made my line drawing tutorial. I wanted to describe how I made interactive diagrams in several other pages. The flow is:
The controls and the visualization are what the user sees. The input, algorithm, and output are running behind the scenes.
Labels: making-of
Updating C++ code on the A* implementation page #
In my articles I have to make a tradeoff between making things approachable and including all the little details you might need in a real project. I tend to err on the side of making things approachable, but that means people can get frustrated when trying to translate these topics into real code.
For my A* pages I have a “theory” page that describes the main concepts but doesn't go into detail with code, and then I have a separate “implementation” page that shows more of the code. I included some C++ code that is abstract and reusable, but I've been unhappy with it. I decided to simplify it a little bit:
- I dropped the template parameter for
SimpleGraphbecause it's only ever used withchar. - Even though
Locationis a property of theGraph, the templated code for this is verbose and distracting so I madeLocationa separate template parameter. - I switched from
unordered_setandunordered_maptosetandmap; in practice you might prefer a hash table or an array, depending on the location type, but it's hard to pick one of these that's best for all cases. - I dropped some of the reference and const parameters.
- I switched from set.count() to set.find() to test membership.
- I wrote out explicit types instead of using
auto. - I used
std::xyzinstead ofusingto omit thestd::namespace.
I have mixed feelings about most of these, and went back and forth a few times before deciding I'm overthinking it and just going with my gut.
Before:
template<typename Graph>
void dijkstra_search
  (const Graph& graph,
   typename Graph::Location start,
   typename Graph::Location goal,
   unordered_map<typename Graph::Location, typename Graph::Location>& came_from,
   unordered_map<typename Graph::Location, double>& cost_so_far)
{
  typedef typename Graph::Location Location;
  PriorityQueue<Location, double> frontier;
  frontier.put(start, 0);

  came_from[start] = start;
  cost_so_far[start] = 0;

  while (!frontier.empty()) {
    auto current = frontier.get();

    if (current == goal) {
      break;
    }

    for (auto& next : graph.neighbors(current)) {
      double new_cost = cost_so_far[current] + graph.cost(current, next);
      if (!cost_so_far.count(next) || new_cost < cost_so_far[next]) {
        cost_so_far[next] = new_cost;
        came_from[next] = current;
        frontier.put(next, new_cost);
      }
    }
  }
}
After:
template<typename Location, typename Graph>
void dijkstra_search
  (Graph graph,
   Location start,
   Location goal,
   /* out */ std::map<Location, Location>& came_from,
   /* out */ std::map<Location, double>& cost_so_far)
{
  PriorityQueue<Location, double> frontier;
  frontier.put(start, 0);

  came_from[start] = start;
  cost_so_far[start] = 0;

  while (!frontier.empty()) {
    Location current = frontier.get();

    if (current == goal) {
      break;
    }

    for (Location next : graph.neighbors(current)) {
      double new_cost = cost_so_far[current] + graph.cost(current, next);
      if (cost_so_far.find(next) == cost_so_far.end()
          || new_cost < cost_so_far[next]) {
        cost_so_far[next] = new_cost;
        came_from[next] = current;
        frontier.put(next, new_cost);
      }
    }
  }
}
The code isn't as fast but I hope it's a little easier to read. I added a section at the end with the faster code.
My goal is to show how the algorithms work, and not to write reusable library code. That's not what I'm good at. Whenever I try to show code, I get into these messes. I hope the code I have is a reasonable starting point for anyone who's writing their own instead of using a library.
This year I'm trying to iterate more and publish things more often. Take a look at the updated A* implementation page and let me know what you think. I'll add suggestions to the Trello page.
Labels: pathfinding
Updating mapgen2 #
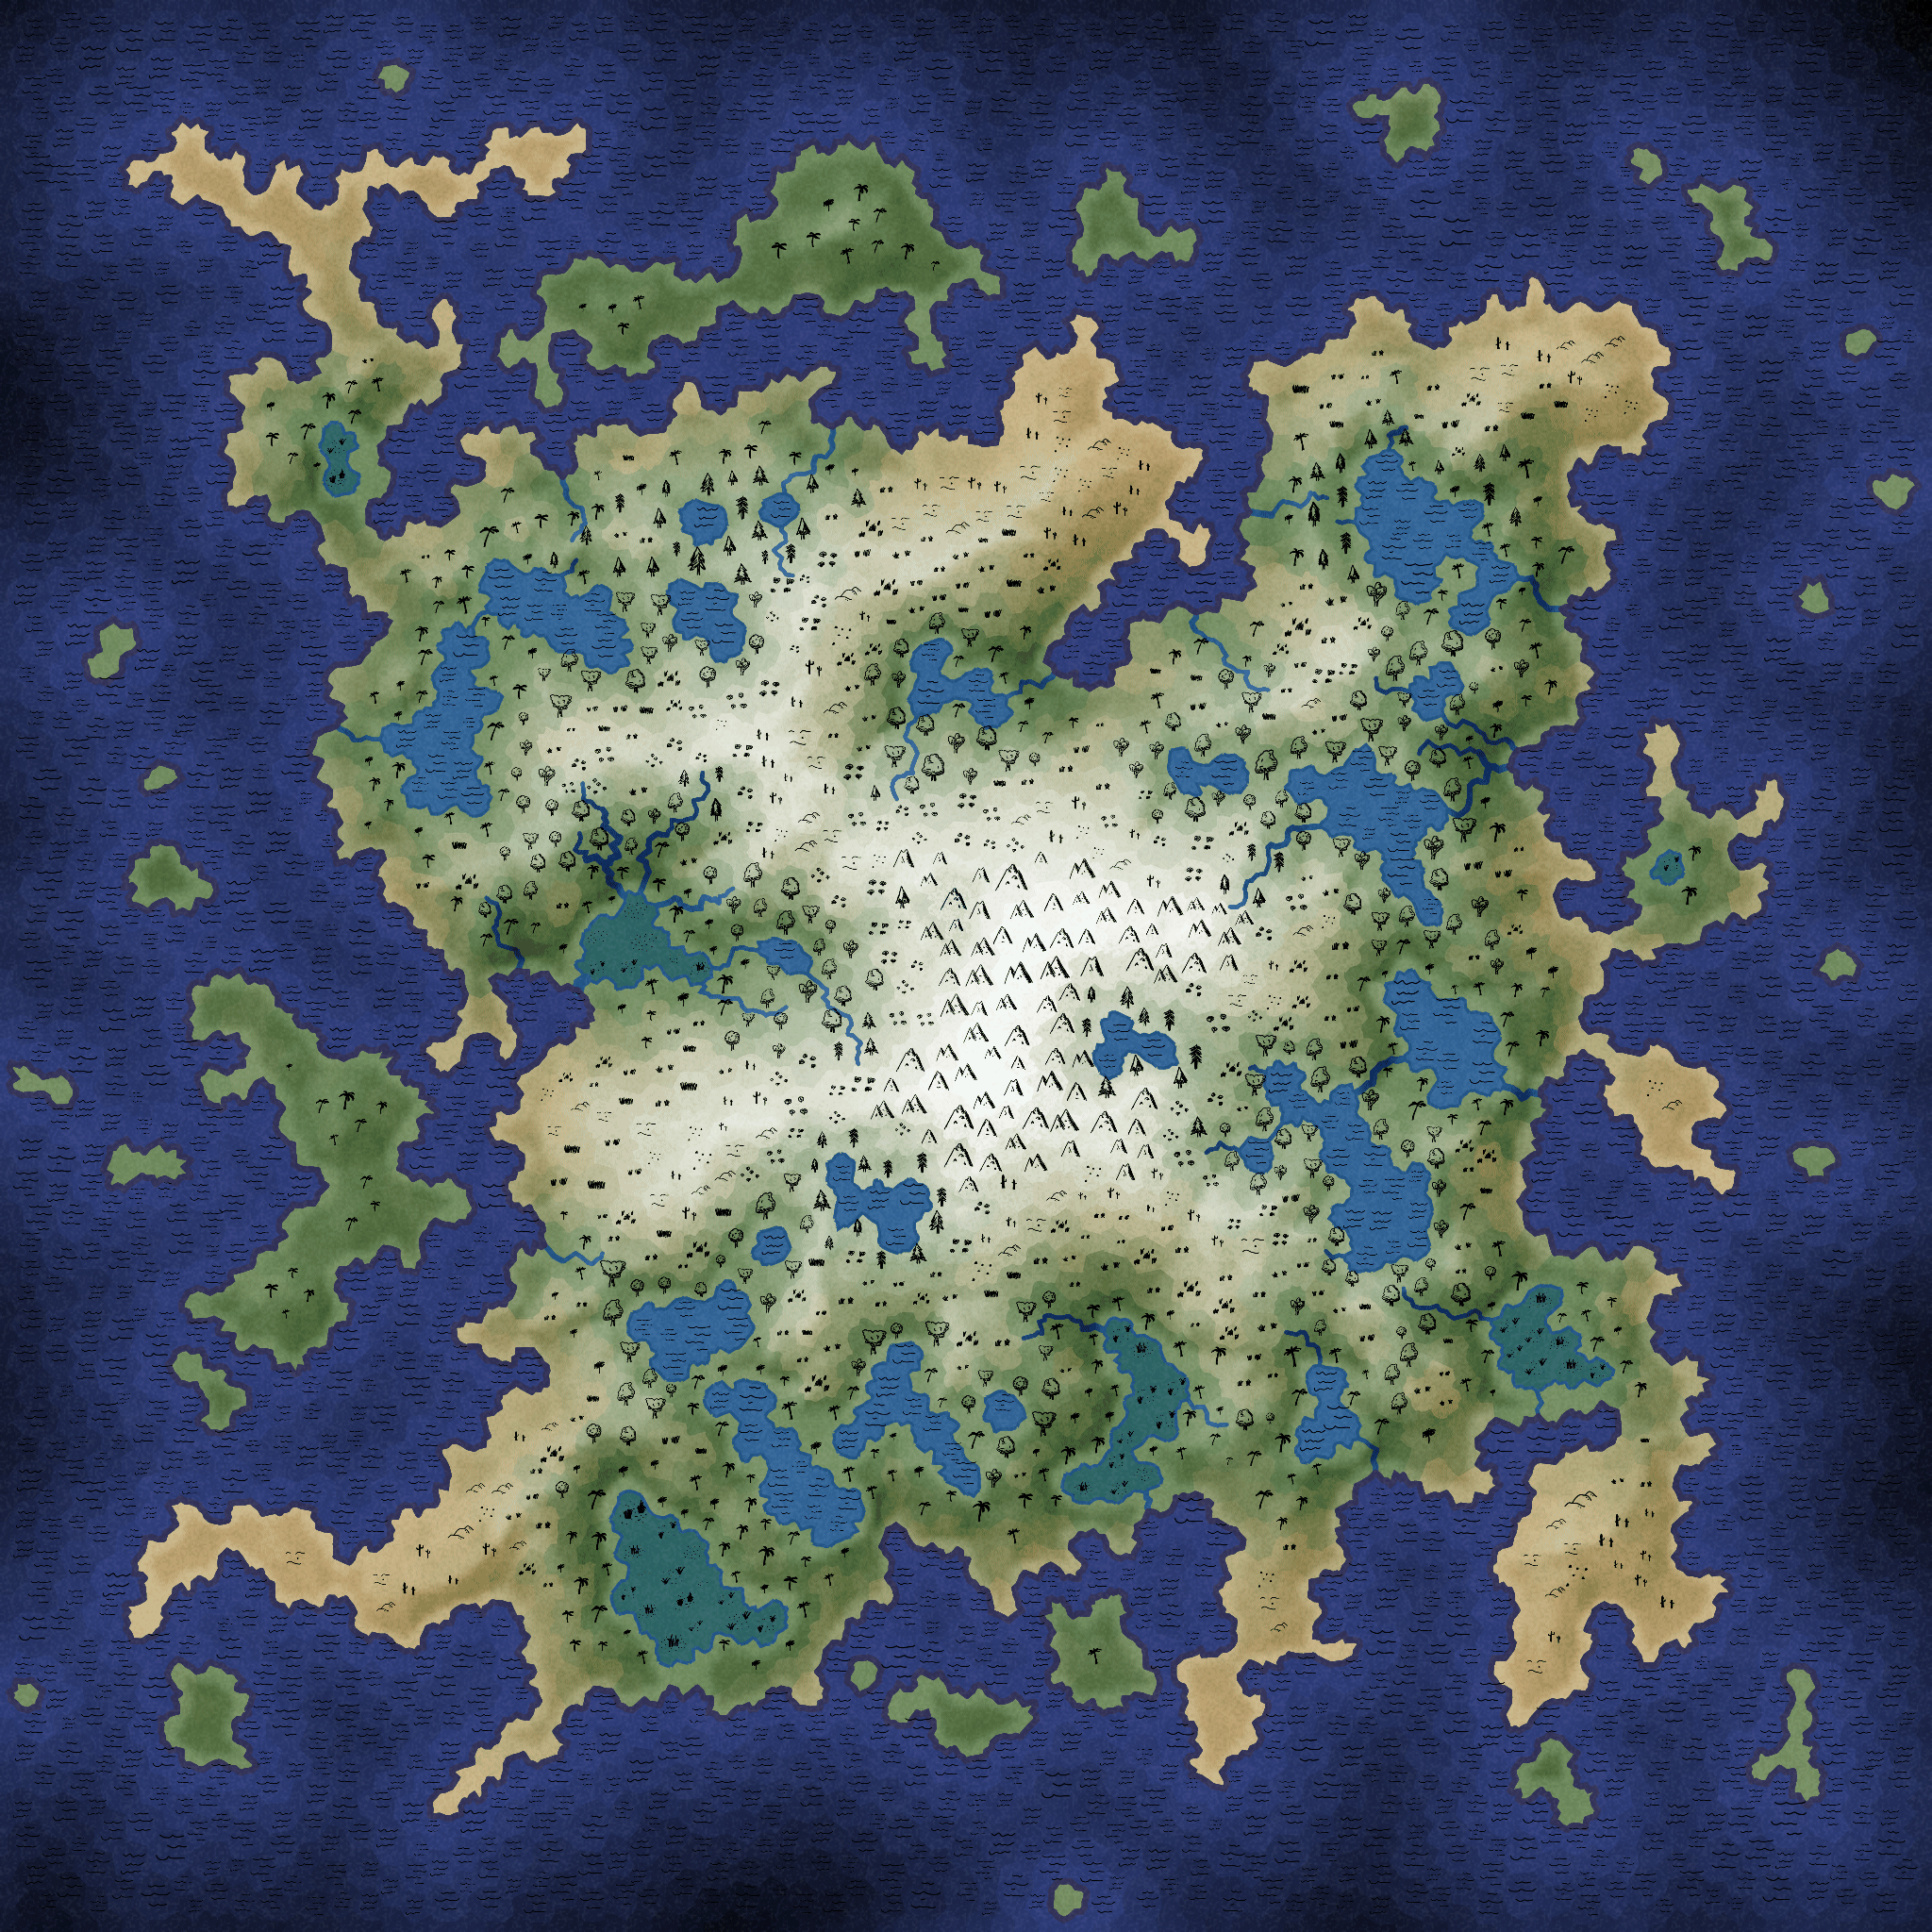
Back in 2010 when I wrote a procedural map generator based on Voronoi polygons instead of Perlin noise, the goal was to produce volcanic islands with a variety of monsters. I had started with Perlin-based height maps but got too much variety in the maps. I decided to use Perlin noise for deciding land vs water, but use other algorithms for everything else. I wanted the players to start on the beach and walk uphill, meeting other players who started elsewhere on the beach and were also walking uphill. I wanted to always produce islands with mountains in the center, so that the players on any beach would travel the same distance to get to the top. The maps were intentionally unrealistic but they were designed to satisfy the game design constraints. I made a Flash demo to accompany the article.
Labels: maps
Thinking about writing #
I'm looking again at traffic to my site and how I write. A few years ago I realized I had a "ratchet" problem. My first articles were less polished, and I felt good publishing them. When I got better at writing, my newer articles were more polished, but I would hesitate to publish. I didn't want to publish until I got everything just right. And as a result I've been publishing less and less the last few years.
Why didn't I want to publish until I got everything right? I didn't want a traffic spike to occur and for lots of people to see my unpolished page:

The trouble is that all the metrics shown in the charts make those traffic spikes look very important. But this cumulative sum chart makes those traffic spikes look unimportant:

The spikes feel good. HEY I got on reddit! But they don't seem that important in the grand scheme of things. Most of my visitors come from day to day visits, not from the spikes. And that means my trying to make sure everything's polished before I put it up may be unnecessary. A friend of mine says I should treat my pages like wikipedia. The cumulative traffic graph supports that.
A few years ago I gave myself an “out” by having "x" pages that were less polished. They were blog entries. They were “fire and forget” pages that I would publish, unpolished, and not update. It worked. I published a lot more. I really liked publishing every few weeks instead of every few months.
The trouble was that it was too easy of an out. I ended up publishing almost everything as "x" pages the last two years, and I think it took away from my regular pages. In particular, the "x" pages let me get away with not iterating. I didn't update them after I posted. And they didn't get better. And then they got very little traffic.
If my pages are like wikipedia I should be putting up incomplete unpolished pages earlier and then refining them over time.
So this year I want to publish more often but more importantly iterate more after I publish. I can treat the early viewers as beta testers. It's the “launch early” philosophy from startup culture (minimum viable product, etc.). I tell other people to do this but I haven't been practicing what I preached.
Take a look at my Trello page to see the kinds of things I want to work on.
Labels: making-of