The past 7 weeks I've been working on my guide to hexagonal grids. Over the years I accumulated a long list of TO DO items on my Trello page, and I finally went through that list and implemented lots of them. Two blog posts ago I described rewriting it from an imperative style to a declarative style, and switching from manual to automatic dependency tracking. In the last blog post I described many of the improvements I made to the diagrams, including several new ones.
As I've added to the page over the years, it's become slower and slower. The main problem is the page loading time. The HTML loads, then the Javascript loads, then the Javascript runs to create the diagrams, sample code, and some of the text of the page. If you follow a link to a specific section, the browser jumps to that section, but then the layout changes as more content is added to the page by the Javascript. This is an unpleasant experience.

One of the goals of the code rewrite was to enable a fix to the problem: prerendering the diagrams on the server. There are libraries like d3-pre that can help with this, and using a virtual DOM library like React or Vue can also help with this. I ended up using Chrome to perform the prerender:
$HOME/Applications/Google Chrome.app/Contents/MacOS/Google Chrome \
    --headless --disable-gpu --dump-dom \ "http://localhost/grids/hexagons/pre-index.html" \
     >index.html
This will run Chrome on the web page and dump the resulting DOM, which includes all the diagrams and other generated content.
If there's any code that should only run on either the server or client, you can detect headless Chrome with:
const isRunningInHeadlessChrome =
     /HeadlessChrome/.test(window.navigator.userAgent);
On the server, I render the content immediately; on the client, I delay it a little bit to keep the UI responsive.
I also made a few other changes, including using <link rel=preload> to load preload images (there aren't many) and <script defer> to defer script execution until the page is loaded.
The result?

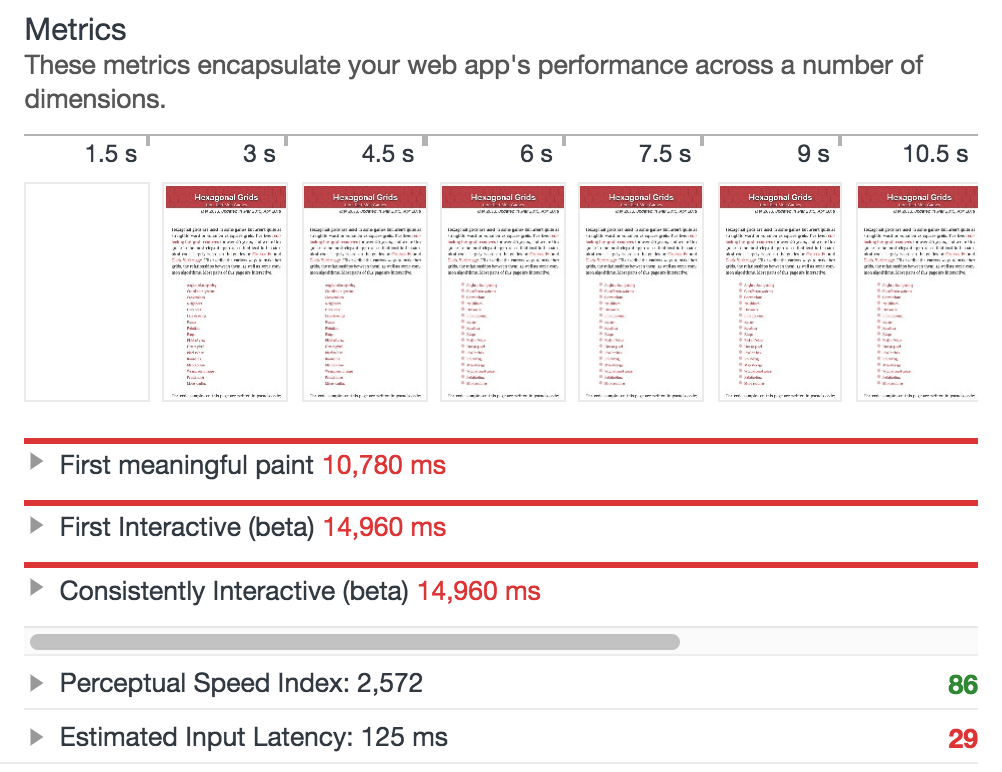
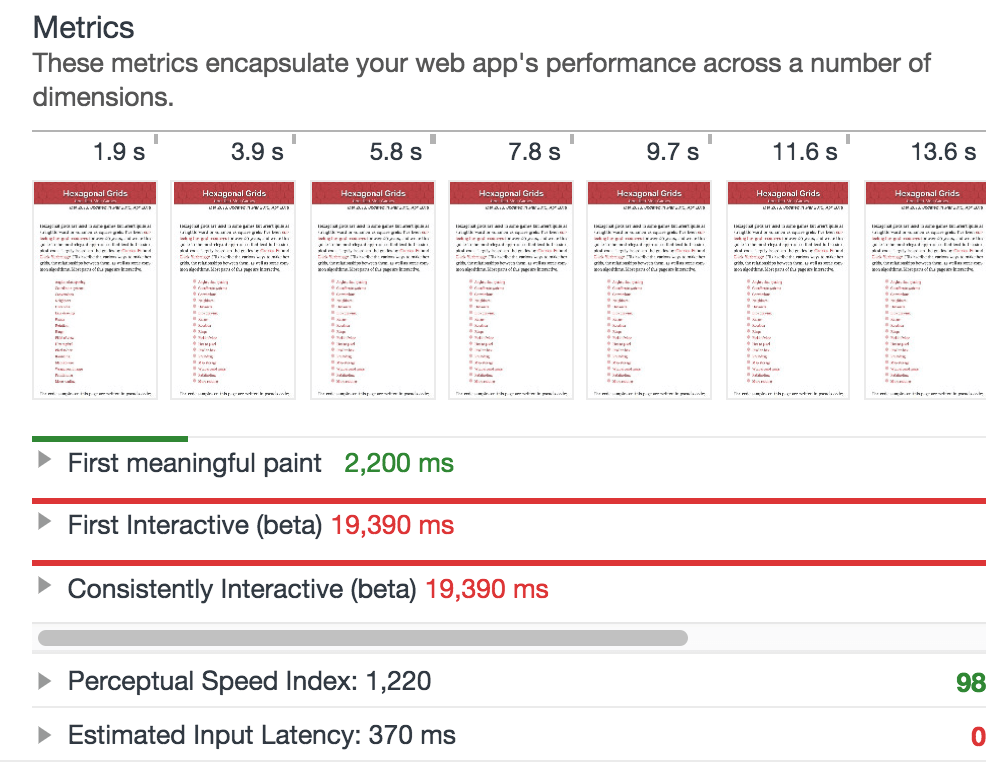
“First meaningful paint” went from 10.8 seconds to 2.2 seconds. Linking to a specific part of the page works reasonably well now.
The downside? The other metrics don't look as good. And the index.html page went from 120k to … nearly 600k. Ugh! (This is even after rounding off all the coordinate values so that the SVG text would be smaller.)
Overall though the new version feels better to me. I haven't tested with a variety of devices or network connections though. If you want to compare, clear your cache and compare the old version to the new version. Leave your notes in the comments. Thanks!
I'm happy with the updates I've made, and I'm going to wrap this up and move on to another project.
Labels: making-of
Great article, thanks!
I'm going to play with headless Chrome a bit. I didn't know it and it looks an useful tool for prerendering. That should solve a few issues with slow loading i'm having on a website at work.
What did you use to get those useful metrics?
@Worthstream: Thanks! It's Google Chrome's "Audit" tool. In dev tools, there's an Audits tab. In there, click "Perform an audit". I only ran the Performance part of it.
Post a Comment