Five Year Mission #
"Space, the final frontier. These are the voyages of the starship Enterprise. Its five-year mission: to explore strange new worlds, to seek out new life and new civilizations, to boldly go where no man has gone before." –Star Trek
Five years ago I started Red Blob Games to help game developers with interactive tutorials and also to make my own games. I had already been interested in interactive tutorials since 2004 and likely even earlier than that, but it wasn't something I had spent much time on. In August 2011 I made a explanation of "blind spots" when driving a car and discovered that by playing with the diagram, I learned things I hadn't ever learned when I had merely read about the topic. I decided to make many more interactive explanations of math and computer science topics, especially for game development. It was something I wanted to see more of in the world.
Around the same time, I discovered the work of Bret Victor. He wasn't writing interactive tutorials for game development, but he was thinking much bigger. Much, much, much bigger. His articles on “explorable explanations” and “ladder of abstraction” made me realize that there's a lot more to this than I realized.
The first interactive tutorial I published under Red Blob Games was at the beginning of 2012, about damage roll calculations and probability. Also early in 2012 I became pessimistic about making my own games so I decided to focus on helping others with my tutorials.
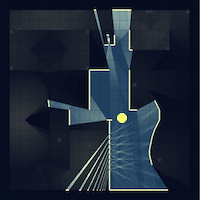
With the probability page, I followed a "textbook style" of starting with the basics and working my way up. I think that style didn't work so well. The top of the page was too bland; it didn't make people want to read more. For my second interactive tutorial, 2d visibility, I decided I needed more of a "journalist style" of starting with the juiciest thing at the top of the page and then the details later. I think this worked better.
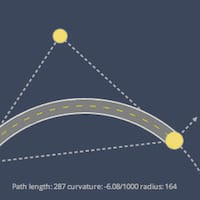
My third interactive tutorial was for curved roads and tracks. This project made me rethink my strategy. In 2012 I had been exploring "small" topics I didn't know much about while learning visualization, javascript, d3, svg, etc. This project took five months, and it was a topic not many people cared about. The combination of I'm learning something new (takes a lot of time, as I'm a slow learner) and it's not very useful stung badly and I had to do something different.
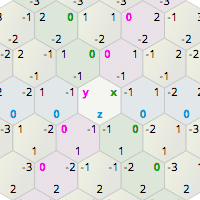
In 2013 I was more focused. I had some topics to explore, and I was better about prioritizing and "shipping". I wanted something that was both a topic I knew about and a topic that would be useful. I started with my guide to hexagonal grids. Not only did I want to have the best reference to hexagonal grid math on the web, I wanted to make better visualizations and a cleaner underlying implementation than I had for my previous articles. I'm quite happy with the way it turned out.
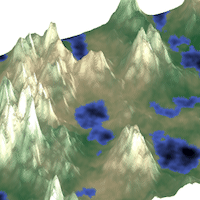
Also in 2013 I used Emscripten to port my old OS/2 game to run in the browser, I spent a month learning signal processing, and finished by writing a page about signal processing concepts and procedural map generation.
In 2014, I wanted to follow the success of 2013 with another topic I knew about and that people would find useful: pathfinding. I started with a tutorial for Tower Defense pathfinding (flow fields), then wrote a longer page about Breadth First Search, Dijkstra's Algorithm, and A*.
One thing that had gone wrong in earlier tutorials was that I explained the theory but not how to implement the algorithms. I had stayed away from implementations because I didn't want to pick a programming language, only to have a different langauge become popular a few years later. I want my pages to last for decades. But at the same time, it was definitely a weakness of my tutorials. I decided to write an implementation guide for the A* page, with both Python and C++ code, as well as a little bit of C#. To make sure that the code I presented on the web page actually ran correctly, I used Emacs Org Mode to write code that would get run during the html export process, and both the source code and its output would be shown on the page. This solved a problem I had with previous pages in which the code on the page would differ slightly from the code I had tested.
My style evolved from "journalist style" to "action movie style". In a James Bond movie, our hero might be falling out of an airplane, fighting the henchman for a parachute. Then the movie switches to Bond talking to his boss about the geopolitical situation in some country. The first scene is exciting but gives no explanation; the second scene is quiet and explains things. The movie alternates between visual-excitement scenes and story-informative scenes until we have a final battle in a secret volcano lair, as exciting as the opening scene, but the viewer now understands the plot and motivations. I now aim to start my tutorials with something cool looking, but without much explanation of how it works. Then I give explanations. Then I give something cool looking again. Then more explanations. Maybe something doesn't work out. Maybe we have to try something different. At the end, there's some demo that's cool, but better because the reader understands the algorithm.
Towards the end of 2014 I went to a workshop that Bret Victor organized to bring people together to talk about interactive documents. It was at this workshop we ended up with the Explorable Explanations page maintained by Nicky Case.
The workshop was absolutely amazing. It inspired me to write up notes on how I write tutorials (draggable markers, A* page). Unfortunately it also paralyzed me when I tried to write new tutorials. I started overthinking everything for a while. When I get stuck on complicated things I find it useful to go back to something simpler. I wrote a quick page about straight lines on a grid.
In 2015, I wanted to try something more ambitious, so I tried procedurally generating downloadable code libraries. I wanted my readers to pick a programming language, formatting style, and hexagonal grid characteristics (offset vs axial, y-up vs y-down, size, skew, etc.), and then my procedural generator would create a downloadable library that implements the hex grid algorithms for their needs. Neat, eh? I wrote a series of blog posts about this (1 - 2 - 3 - 4 - 5 - 6 - 7). I wrote an implementation guide and also generated code for C++, Python, Javascript, C#, Haxe, Java, Typescript, and Lua. I also procedurally generated unit tests for each of those languages and ran all of them as part of the publish process.
I also got a bit distracted working on pathfinding optimizations. I wrote a partial page about differential heuristics (which I think is a fantastic optimization with large speedups from little code) and a partial page about waypoint graphs instead of grids (which I'm less excited about now). 0fps wrote a nice optimized grid pathfinding library; I tried it and it ran A* in a mere 1-3 milliseconds on an 800x800 grid map. Pretty cool. But I didn't understand the algorithm and didn't write a tutorial about it.
I realized at some point that my most successful pages were about problems that I had in a real project, and the least successful pages were about problems that I expected to have in a future project. Curved roads and tracks weren't something I needed for a real project, as I've always used grids in building games. Regular A* was fast enough for all the projects I had worked on, so optimizing it further had never been something I needed to do for a real project. Every time I ventured into a topic where it didn't matter for my own projects, that tutorial failed.
This hit me hard. Over the past three years, half that time was wasted writing things that didn't really work out.
I decided that I needed to work on more real projects. I dug through existing projects to see if there was anything I hadn't written much about, and I found one: simple procedural map generation in 50 lines of code. The rest of 2015 I spent updating my skill set (C++, OpenGL, physics, networking, shaders, distance fields, etc.) instead of tutorials, so that I could work on real projects.
In 2016, I updated some of my existing pages (1 - 2), but lost motivation to work on new tutorials. I tried several times to work on a tutorial about coordinate systems but failed each time. I continued learning things by working on small projects (React.js, SVG, Lua, WebAudio, Pixi.js, neural networks, hexagonal tiling of spheres, stylized map rendering) but I don't have much to show for it. I've worked with game developers on small projects but don't have anything I can share yet.
So that's the past five years.
- The first year I worked on small tutorials and learned how to use Javascript, text, and diagrams to build the kinds of explanations I wanted to build.
- The second year I made the guide to hexagonal grids and a few other things.
- The third year I made the A* pathfinding tutorial, started adding implementation guides to my pages, and came up with a style I liked for my tutorials.
- The fourth year I wrote some fun projects but nothing had the impact of my earlier work, and I started to figure out why.
- The fifth year I learned a lot but lost motivation to write big tutorials.
I'm very happy with what I accomplished during this five year mission. The hexagonal grid guide and the pathfinding tutorial are the best things I've written. I loved exploring the capabilities of the medium. Web articles can be interactive explorations of topics and don't have to be static like magazine and newspapers articles. When I started, very few people wrote interactive essays, and now I see many people writing them. I think we'll see a lot more of them.
I love writing tutorials and I love working with game developers, but 2016 convinced me that I need to change my path. I don't know what's next for me. Will I extend my mission? Will I write my own game? Will I move on to something else? I don't have a plan for 2017.
Update: [2017 Mar] Going to the Game Developers Conference helped convince me that I should spend my time helping people make interactive tutorials. I'm working on two tutorials with other people, I've joined communities of people making interactive tutorials, and I'm also mentoring summer interns who are making interactive diagrams. Thanks for all the support!
Labels: annual-review
Procedural name generation using pronunciation changes #
Update: [28 Nov 2016] I had written this blog post quickly, without really explaining the context; see my notes for a better explanation.
People have used sequence-to-sequence recurrent neural networks to "translate" words into pronunciation for speech synthesis. I have been trying to go the other direction. I was inspired by the name "Daneel Olivaw" in Asimov's stories. It's similar to "Daniel Oliver" but it's a little different. The idea is to take English names like Susannah, Michael, etc., convert them to pronunciation phonemes, alter those phonemes in some way (such as the Great Vowel Shift of Middle English), and then convert the altered pronunciation into a new spelling. Then someone could use these new names for a story or game.
I think of it as a "Spelling Bee" neural network. It hears the name and has to come up with a spelling for it. Unlike a regular spelling bee, this is for made-up words. These are results I've gotten so far:
- Changing the N in Jennifer → Jemifer Gengnifer Gethopher Jeffepher Jessifer Geshifer Gethopher Jeviffer Jesapher Jesifer
- Changing the C in Christopher → Bristougher Dristofer Gristopher Prestofer Tristofer Threstougher Fristopher Srystofer Shrystofer Thristopher Vristofer Zristopher Ghrystofer
- Changing the first E in Stephanie → Stophony Staphony Stophanie Stophony Stophony Styphony Sterfaney Staphony Stiffony Stephony Stophani Steuphony Stuphony Stuphony
- Changing the IE in Daniel → Danall Danall Dannell Dannall Danhowl Danile Danelle Dannerl Danail Dannyll Danielle Danole Danoyle Danule Daneule
I'm also going to try prefixes and suffixes. It's been a fun mini project. I got to learn some TensorFlow and recurrent neural networks, even though for the most part I'm just patching together code I've found without really understanding it. The results so far seem like plausible spellings for words, but most of them aren't sufficiently name-like.
Something that I hadn't thought about before: there can be lots of different spellings for the same sounds in English (what a messed up language!). For example michael → M AY K AH L but the AY K AH reverse maps to ichae in michael, icu in bicuspid, ica in formica, iche in lichen, yca in lycan, yco in glycogen, yche in psychedelic, yc in recycle, so which of these "should" it be using when spelling that sound? How would the neural network be able to learn something if there isn't a good answer?
See my notes for a longer explanation of what I was trying to do.
Hexagon tiling of a sphere #

Recently two people asked me about making a tile-based game that uses a sphere topology. Some games have tile maps that wrap around. Civilization for example lets you go off the left side of the map and you warp to the right side. You can’t go off the top or bottom of the map. In 3D space, this would be a cylinder. Some games also let you go off the top side and warp to the bottom, and vice versa. In 3D space, this would be a torus. But most tile map games don’t use a sphere. Why? The sphere doesn't tile. I thought … can we almost tile it? The answer is yes!
I wrote up my notes here including a small interactive demo. This is a quick & dirty investigation and not one of my longer polished articles; see this post about my wanting to write pages more quickly.
Outside the box #
I write interactive explanations; I'm always looking for simpler ways to explain things.
Think back to every technical paper you've read. The text connects to diagrams by using text such as "see figure 4". Maybe it's more specific and says "in figure 4 see circle 24". Maybe it's a hypertext link. However if I look at how I take notes on paper, I don't do that! I just draw an arrow to the thing I want to point to.
From an early age we have invisible boxes around text and diagrams, keeping them apart. It doesn't have to be this way. Pointing is the simplest way to direct attention to something. Why don't we do it more? I don't know, but these are the kinds of things I'm exploring on the web.
How did I implement this? The first guess would be that I'm using
a giant SVG overlay that covers the area between the pointer and
the target. I'm not! That's
the only SVG element in this blog post. What's the trick? By default, the overflow for an SVG element is set to hidden; in some versions of IE it was visible and
I had to set it back to hidden. That keeps the content inside its
bounding box. But the IE situation made me wonder — if I set it to visible,
what happens? It turns out you can draw outside the box! This
seems to work across the browsers I've tried.
The second thing I need to do is construct an arrow path. The
source and target of the arrow may be in different SVG elements,
or they might not be SVG at all. For this page I use
an invisible span
in the text as the anchor. I use getBoundingClientRect() to
get the coordinates on the page. Then I pick the midpoint of one
side of the rectangle as the arrow source or target. I need to
translate all the coordinates into the coordinate space of the SVG
I'm drawing into.
For this demo I hard-coded the size, curvature, and directions of the arrows. I don't adjust them when the page is resized. For a reusable library, I think it'd be cleaner to have one svg per arrow anchor.
3 Whys - what problem am I addressing? #
I've wanted to write a page about coordinate transforms, but I've started it and abandoned it several times.
The first version was about matrices. I had seen Nicky Case's interactive explanation and Max Goldstein's animated explanation but I wanted to write something more basic. I wrote out an outline showing how matrices could be used for translate, scale, rotate, and shear transformations, and how those could be combined or inverted to generate all the effects we want.
After struggling with this for a few weeks, I put the page on hold.
I returned to it after a friend of mine suggested that I take matrices out completely. I had to ponder that for a while. Surely, the whole point of the page was to show how matrices worked. How could I do that if I took out matrices?
I came up with a new outline that pushed matrices to the very end. I covered all the transforms first, with simple code to implement each. If you have a series of transforms A, B, C, and you want to transform point p, you can call C(B(A(p))). At the end I introduced matrices as a uniform representation of all the different types of transforms. They also offer a way to combine transforms together, so that you can call (C ∘ B ∘ A)(p).
I had implemented lots of interactive diagrams for this page (see the draft version), but in the end I was unhappy with that version too.
There's a technique called 5 Whys (or 3 Whys) that I should've tried.
Why do I want to explain matrices? Because they are a nice way of implementing transformations.
Why do I want to explain transformations? Because they are a uniform way of thinking about operations we need in games: translate, scale, rotate.
Why do I want to explain translate, scale, rotate? Because they are a clean way to solve problems with game cameras: scrolling, zooming, rotating, and isometric views.
Aha! Maybe that's the real problem: game cameras. Instead of starting with matrices and then explaining how they represent transformations and then explaining how transformations can be combined, I could start with game cameras and then work my way up to transformations and then matrices.
I'm going to make another attempt at an outline for this page starting with game cameras.
Update: [2016 Aug] Well, I failed. I lost motivation to work on this so I've put it on hold … again. I think I may take a long break from tutorials.
Labels: making-of
Minor A* page improvements #
There are some big things I want to change on my pages, but there are lots of little things too. The big things I keep delaying because they're "big projects" that need a chunk of time. But the small things I've been delaying too, because I keep telling myself I'll do them when I do the big one.
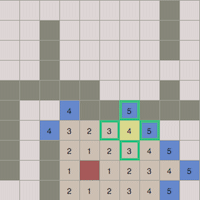
Right now I'm not working on any big projects so I'm tackling some small improvements. This week I improved the path reconstruction diagram on my A* introduction. It looked like this:

What's wrong with this?
- The contrast is too low between the arrows and the background. I had been using a lighter background for "unvisited" nodes and a darker background for "visited" nodes, and I also separately had chosen an arrow color that matched the
came_fromvariable in the example code. - The start node shows the blob icon but the goal node shows no icon. This is inconsistent with other diagrams on the page that show both a start and goal icon.
- The tricky bit here is that the arrows point backwards from the goal to the start. It's easy to miss this.
I made some quick changes; it now looks like this:

- I stopped using the darker background to distinguish visited/unvisited because in this diagram everything is visited.
- I added a goal icon that matches the other diagrams.
- I added goal/start icons to the code to remind the reader that the loop starts from the goal, not the start point, and works backwards.
I think it'd be even better with an arrowhead along the path to show the direction, but I was unable to get something I liked, and I didn't want to spend a lot of time on it, so I abandoned the arrow. Another thing to try would be a small animated dot • following the path from the end to the start, color matched with the current variable in the code. That's something I'll consider later.
There are lots of little improvements I'd like to make to my pages, and I would probably be better off making them now instead of waiting until I have time to make bigger updates.
Labels: making-of , pathfinding
Updating my Introduction to A* #
One of the things that's bothered me about my Introduction to A* page and also my older A* pages is that I use grids everywhere. I fear that some of my readers will think that A* is only for grids or that it's best with grids. In my opinion it's worst when it is given grids, especially grids where every step has the same movement cost.
I decided the simplest thing I could do would be to change the grid map at the top of the page. That's the first impression a reader gets. Instead of showing non-grid maps halfway down the page, I should show a map that's not a grid. That way the reader immediately sees that we're not solving a grid problem. This was the first map on the page:

I took some graph paper and came up with a polygon version of this map. I hand-coded it and got the A* page to show it:

Although making the initial version of this map with pen and graph paper wasn't too bad, iterating was quite a pain. I decided to make a quick & dirty tool to edit the shapes. I wanted to edit the graph connectivity too but didn't want to spend more than an hour writing the tool, so I didn't implement that. I put the connectivity in manually.

The tool helped a lot! I made it output JSON, and then I copied-and-pasted that JSON into my A* page, where I wrote some code to turn that into the diagram. I spent a few hours on that map and also several others. The tool made it so much easier to edit maps that I ended up making more maps for the page.
After I had this new map up, the next step was to add a section to the page that described graphs. Although I have a link to another page that describes graphs, I think the input and output to an algorithm are too important to not explain on the main page.
I had implemented the A* diagrams with layers (see this); I was able to easily add new layers to show graph nodes and graph edges. With this I made a new diagram:

I wanted to demonstrate two things with pathfinding graphs:
Completely different game maps might have similar pathfinding graphs. I drew a game map based on StarRaven's cartography brushes that shared the same pathfinding map as the main example.

The same game map can be represented by different pathfinding graphs. I added two more pathfinding graphs for the same game map:


Comparing these, you can see how A* has to do a lot more work when the pathfinding graph is a grid than when the pathfinding graph is a navmesh or waypoint graph. If you're looking to optimize pathfinding on a grid, the first thing to try is to construct a non-grid pathfinding map.
With all of the new content on the page, I also wanted to simplify some of the other parts of the page. I decided that the contour maps were the least valuable concept, and removed most of the contour map diagrams. I think it's an interesting way of looking at things, but I was never quite happy with them, and they probably belong on an advanced level page, not on this introductory page.
While testing on iPhone and Android, I realized that I had never finished a touch version of the drag-and-drop maps. Until now, it didn't matter, because the diagrams were grid-based, and I had a touch version of the grid code. I had to fill in the non-grid touch event handlers. It doesn't work that well but it's good enough for now.
I'm much happier with the page now, although I still have some work to do on the wording. Take a look! There's still more I want to improve on this page.
Labels: making-of , pathfinding
What I did in 2015 #
It’s been a while since I wrote a blog post. What did I do in 2015? The first part of the year started out good. I worked on hexes:
- I updated my Hexagonal Grid Reference with better explanations, better diagrams, and better sample code.
- I worked on a procedural code generator (1, 2, 3) that generates hexagonal grid libraries in C++, Python, Javascript, C#, Haxe, Java, Typescript, and Lua.
- I also procedurally generated the unit tests for those libraries, and ran the generated unit tests on the generated code.
- I also used the generated Javascript code for a new page, a guide to implementing hex grids. My tutorials are typically about the algorithms and not the code, but for this topic I made an exception.
After that, I lost my way. I became interested in pathfinding optimizations, and wrote some things that I didn’t finish:
- L1-Clarkson based A*, with a super fast implementation from 0fps. People often want to optimize the algorithm but a lot of the time, it’s better to focus on the data. Unweighted grids are a waste of A*’s capabilities; you can greatly speed up A* by not feeding it such inefficiently structured data. The algorithm demoed on this page implements one such possible transformation. Try the demo — it takes only milliseconds, in javascript, to find paths on a large grid map. For references and code, see this page.
- Differential heuristics demo and article. This is something 0fps recommended I explore. It turns out to be pretty awesome, with huge speed improvements with only a few lines of code. Unfortunately I lost interest partway through.
- Visibility graph construction to turn unweighted grids (tons of nodes for A*) into lightweight graphs. This can both speed up A* and make the paths on a grid look “straighter”. Unfortunately with this topic too I lost interest partway through.
The problem, I think, is that in my own games I’ve not needed these optimizations. So I was exploring a set of potential optimizations that I haven’t actually needed. In practice, a lot of optimizations are specific to a project, and without having worked on a real project that needed these, I didn’t have the confidence that they were good recommendations. Also, knowing that I haven’t actually needed these reduced my motivation to explore them.
The pathfinding optimization part of the year mostly fizzled, so I stepped away from that topic and worked on other topics:
- I improved one of my older tutorials, on Probability / damage rolls. I wrote a blog post about why I was unhappy with the original version and what I did to improve the tutorial.
- Some people see my tutorial on polygonal map generation and walk away saying it’s too complicated. Well, it is. That’s not where I started. I started with something much simpler and worked my way up to the complicated one. I wrote a tutorial on the simple map generator I often start with. It’s limited, but it’s simple.
Realizing that my tutorials are better when they come from experience with real projects, I decided to take a break from tutorials and instead try some small game projects. In the last few months of the year I worked with Jetbolt Games learning about browser-based MMOs. We used Emscripten so that we could write both the server and client in C++. I played with SDL and OpenGL shaders, as well as network synchronization. This was a fun few months. It was nice to do something different. I didn’t write any of this up.
I also worked on a bunch of small projects throughout the year:
- Beta distribution from statistics — I’ve been pondering applying the interactive essay techniques I use to non-game topics. I got positive feedback from testers but haven’t worked on more math topics yet. Did you try to fill in the square? Hmm.
- Influence maps — just for the pretty pic (I think I wrote this between GDC sessions)
- Max of noise functions — I thought it might be useful for maps but I wasn’t that happy with it
- Procedural face generator — incomplete but fun to play with
- A simple shape editor that I used when making shapes for an articulated movement test using box2d. I decided that physics engines are cool but not for me. I’d rather work with grid games.
- Distance field sprites — for possible future use in a game project
- Dividers between hex regions — sometimes I write an interactive demo as a reply to a reddit question
- Chained movement — like the Snake game, but the chain can be slack
The next step for me is to get back into writing. I’ll start with some small projects and then I’d like to explore some algorithms that are useful in simulation games like SimCity, Dwarf Fortress, Rimworld, Prison Architect, Cities Skylines. For example, I learned about Munkres-Kuhn from Goblin Camp, an open source game inspired by Dwarf Fortress, but haven’t yet explored this algorithm.
Oh, and I’ve also been spending time in nature.
Labels: annual-review