March updates: lots of small things #
One of my goals this year is to publish in smaller chunks instead of trying to do everything in "one big launch". This is what I've been working on over the past few weeks:
Using Vue with Canvas #
In my last post I had said I was trying out some libraries to automatically track dependencies for me. The one I'm playing with right now is Vue.js. It can track dependencies between data and the HTML/SVG elements. For example if I write SVG:
<circle :cx="center.x" :cy="center.y" r="30"/>
and I have it hooked up to data:
data: {
  center: {x: 100, y: 150}
}
then Vue will remember that the circle depends on those x and y properties. If I modify the data with center.x = 75; Vue will detect this and update the circle. This is quite convenient!
How I implement my interactive diagrams, part 2 #
In the last post I described how I structure my interactive diagrams and gave some examples. In this post I'll describe what I'd like to do for future diagrams.
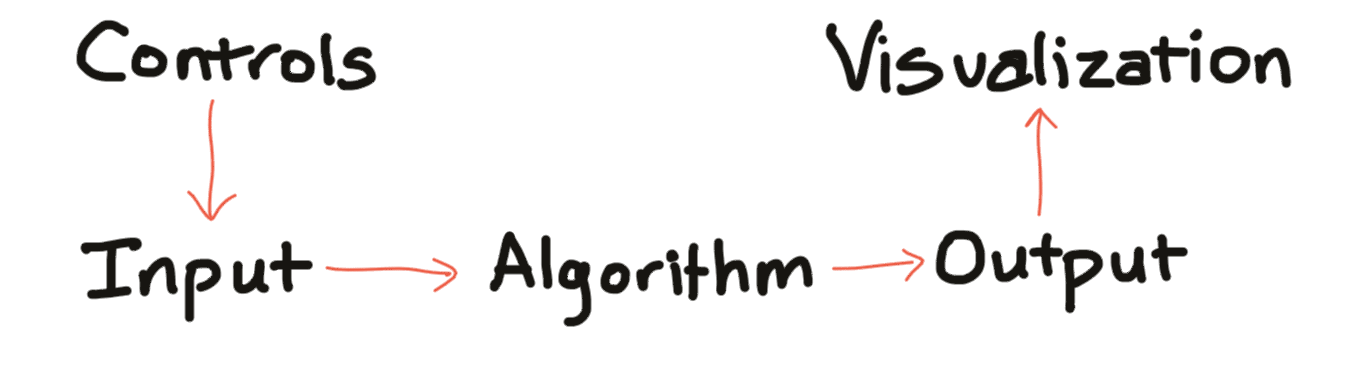
When I started writing interactive diagrams I used d3.js, which is a great visualization toolkit. At the time I thought data visualization was the hardest part of what I was doing, and I needed a library for that. Since then, I've seen other libraries — React, Riot, Ember, Mithril, Intercooler, Marko, Vue, Aurelia, Ractive, Rax, Svelte, MobX, Moon, Dio, Etch, Hyperapp, S/Surplus, Preact, Polymer, lit-html, Elm, and many more — that have given me different ways to look at the problem. I've realized that the visualization isn't the hardest part of what I'm trying to do. There are two two big problems I want a library to help me with:
- How do I update the visualization?
- Which algorithms do I need to run again?