What I did in 2021 #
It's time for my annual self review. It's been a messed up year, not only for me but for many other people. Last year I said I wanted to learn some biology and math. I didn't have any particular goals for game or tutorial projects. I knew the year would be a mess so I left it open ended.
Labels: annual-review
Summer of small projects #
I've kinda been quiet for a while. The main reason is that world events finally got to me. I had been doing ok mentally, working at home, spending a lot of time outdoors, etc., but eventually the COVID pandemic and the California drought+wildfires drained me mentally, and I spent much of the summer unproductive.
I decided to get going again, I should work on easier things. This strategy has worked in the past for me. I spent part of the summer following the reddit r/roguelikedev summer tutorial series. Each week I approached the tutorial topics but decided to implement them differently than what the tutorial did. I implemented "thin walls", a different inventory system, a different ui, a new map generator, tile graphics, and a few other things. It was fun. It wasn't too hard. I wrote up my notes and included a playable version.
After that project, I looked through my ideas list and remembered that I want to make a lot of small updates to existing pages.

Highlighting diagrams and text together #
I love the annotated geometry proof here. It doesn't take a lot of JavaScript to make. The main idea is to annotate the text and also the diagram, and then use the annotations plus CSS to drive the highlighting. I wanted to recreate a tiny bit of it to demonstrate how to make something like this. Live demo:
Labels: howto
Rewriting my grid parts page #
If you've followed my work you know I'm a fan of grids. I had a page I wrote in 2006 that I decided to update. Those were the days before html5, and even before SVG was reliable in browsers, so I had made images using some Ruby code to generate SVG, and then ImageMagick to turn SVG into PNG. If I'm going to update this page, what might I want? I made a list of possibilities:
- Change of focus. The old page spends a lot of time talking about the properties of grids in the abstract, and how different grid types relate to each other. When I visit the page for my own needs, I don't care about that. What I do want to see is the formulas. I use this page as a reference. I want to change it to make the formulas the main focus of the page.
- Interactivity. I could make all the diagrams interactive. That's what people expect from me, after all!
- High resolution diagrams. We're not living with 800⨉600 desktop monitors anymore. With "HiDPI" screens including 4K, I wanted to use SVG everywhere so that the diagrams are sharp.
- Put coordinates into the diagrams instead of only off on the side.
- Make the relationship diagrams for all three grid types. On the original page I have diagrams only for squares.
- Animations showing how square grids relate to triangle and hexagon grids.
- Animation showing how square grids relate to isometric grids (which are really isometric views of a square grid).
- More algorithms including distances, to screen coordinates, from screen coordinates.
- Sample code generation, so that you could select a programming language and see sample code in your favorite language.
Labels: grids
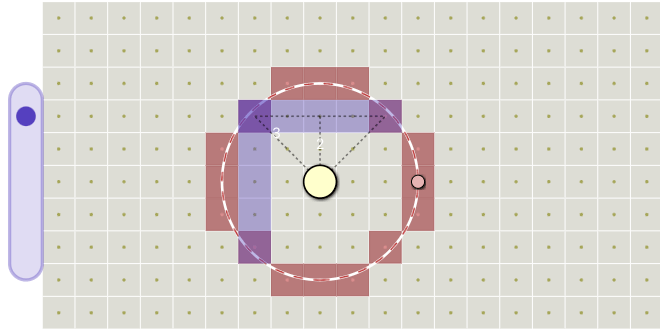
Redesigning my circle diagrams, part 2 #
In the previous post I described how I redesigned some of the diagrams on my circle drawing page. I found that I had been reusing code in ways that made the diagrams worse. I switched to more copy-paste programming to make the diagrams better.
Labels: design
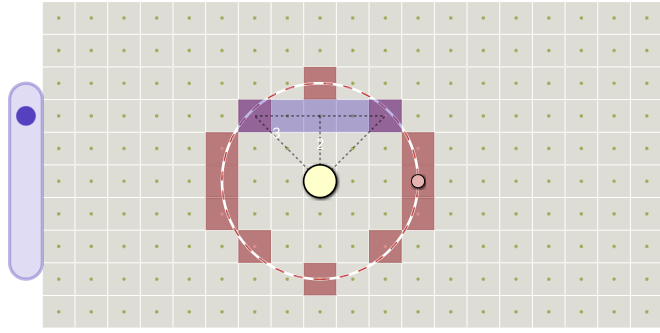
Redesigning my circle diagrams, part 1 #
Linus Arver's post about circle drawing reminded me that I wanted to add circle outlines to my circle fill page. My page is focused on circle fill rather than outline, but one of the fill algorithms can be adapted to generate outlines instead. I added a section on circle outlines, reusing the code from the circle fill diagrams. Unfortunately … I didn't like the result.
Labels: design
Learning by writing #
I've been learning about the mathematical modeling of predator-prey relationships. The idea is that as the population of a prey animal (like mice) increases, the population of a predator animal (like foxes) will increase because they have lots of food. But then the mice will be eaten so their population will decrease, and then the population of foxes will decrease, and the cycle will start over again.
This blog post isn't about predator-prey though. It's a peek at how I learn things with note taking (see my previous blog post) and small projects. You might have seen some of my many lightweight explanation pages (examples: noise, hexagons on a sphere, organic cave maps) but they often don't start out that way.
My personal information workflow, part 2 #
In part one I described the kinds of things I asked myself when deciding on how to manage my personal information — bookmarks, references, notes, tasks, contacts, etc. The answer is: I don't have a single consistent system that I use for everything. I use many incompatible systems depending on where I am and what my goal is.
My personal information workflow, part 1 #
Several people have asked me how I organize my projects. There are various systems out there like David Allen's Getting Things Done, Taiichi Ohno's Kanban boards (e.g. Trello), Ryder Carroll's Bullet journal, Niklas Luhmann's zettlekasten (e.g. Roam Research), Dave Seah's Emergent Task Planner, and many more.
There's a danger in spending too much time organizing my projects instead of working on my projects. Questions I asked myself:
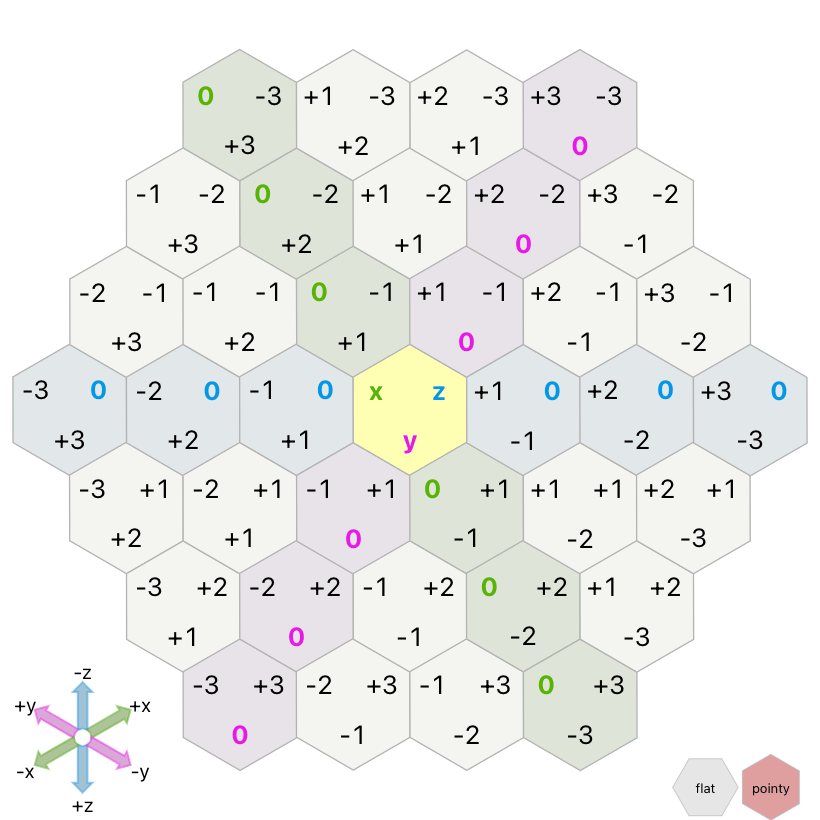
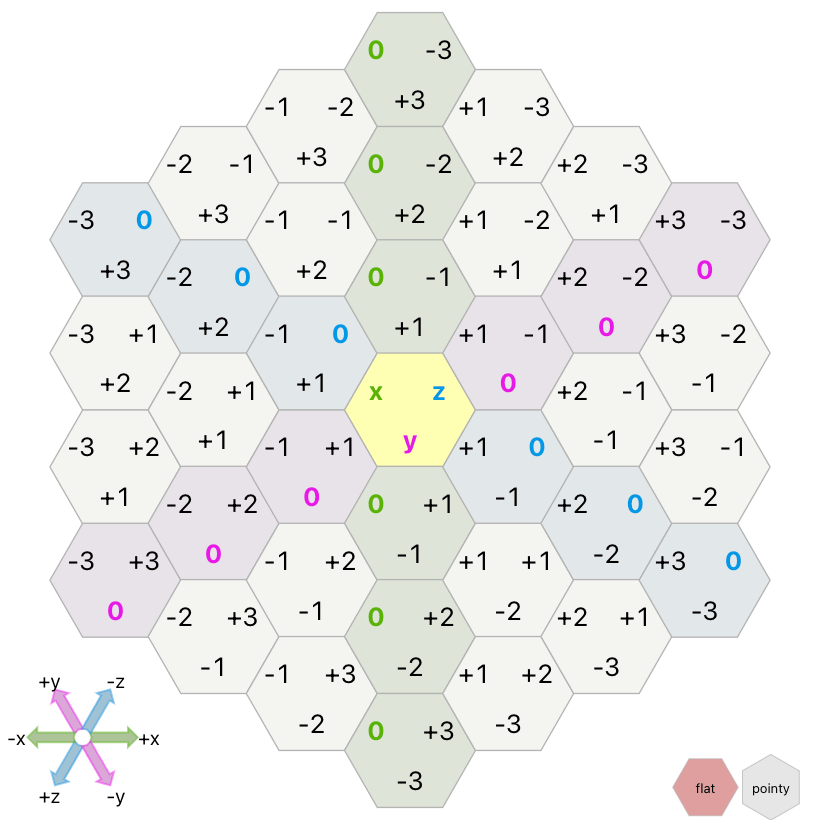
Hex diagram labels #
A few weeks ago a reader suggested the labels on my hex diagrams for the "cube" coordinate system could be improved. I took a look at what I had: