“We can rebuild it—we have the technology.”
Over the past few weeks I've been reimplementing my guide to hexagonal grids. I'm generally not a fan of rewrites that have no end-user benefits but there are lots of improvements I want to make to the page, and the convoluted code was making it harder to make the changes I wanted. I ended up spending 60 hours on this, reduced the number of lines of code from 2400 to 1400, and reduced the total Javascript sent to the browser (gzipped) from 85k to 54k. A large part of this was rewriting the diagrams to use Vue.js instead of D3.js. As much as I love D3, there's not much on the hexagon guide that benefits from it, and I ended up using it as a nicer JQuery. In a previous blog post I described wanting dependency tracking. That's why Vue.js worked well for this page. I think React would've been a reasonable choice as well, but on this page Vue fit my needs better.
Part of the motivation for this rewrite was to enable server-side rendering. The page has 29 diagrams, and it takes a while to generate them all while the page is loading. The initial SVGs are the same each time, so why not pregenerate them on the server? From my initial tests, the server-side rendered page renders much quicker because it's not waiting for any Javascript. However, I still need to test this a lot more, and it'll have to wait for another day.
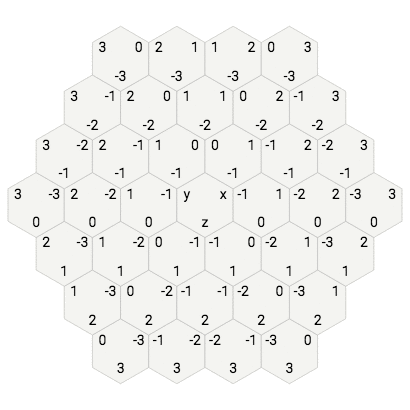
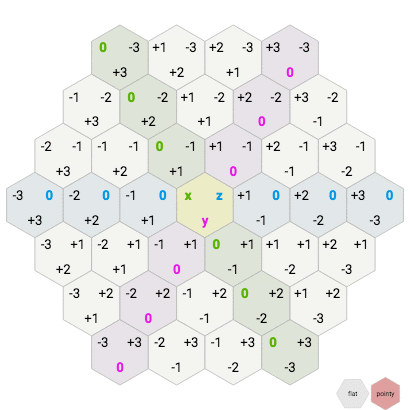
One of my goals this year is to make lots of improvements to my existing pages. Here's an example of a small change. The cube and axial grid diagrams have coordinates written in each hex. In the new diagrams, I made these line up to show the correspondence between the two systems.
While rewriting the code I made lots of small changes:
- All the hex code used to implement these diagrams is from the procedurally generated code shown on the implementation page (this is one way to make sure that code works!)
- Pseudocode is now consistent:
varfor declarations;#for comments;OffsetCoordinstead ofHexfor offset coordinates (because Hex is axial and has different properties); consistent indentation; a different name for each function instead of reusing them for different grid types - Animation: no longer runs on initial load (it was never meant to but I never fixed it until now); has a tiny bit of "bounce"; pointy/flat layout animation uses rotation instead of sliding, which results in a better sense of how the layouts are related (see sliding in diagram 1 and rotation in diagram 2 on this test page); tied to Interaction Observer (previously was my own hacky code that watched the scroll position)
- All diagrams: fixed clipping issues so all diagrams are completely visible; initial state of diagram is non-empty so that you can see results before interacting with it (this helps when you're quickly scanning the page to find the diagram that has what you want, because you don't have to interact with each one to see the output)
- Most diagrams: added a small button to toggle pointy/flat the orientation (in the old page, you had to scroll up quite a bit to find these buttons near the top of the page)
- Interaction: touch events now work to highlight a hexagon; wall drawing works with mouse drag (but not with touch)
- Angles diagram: added an arc for the interior angle; added shading to the triangle
- Size and spacing diagram: added dots on corners to show how they line up with the axes; animated the axes change including fading labels in/out (old diagram abruptly switched axes - see comparison); changed the text to match the labels on the diagram; cleaned up the wording of the text
- Coordinate labels on many diagrams:
+sign to positive numbers to better distinguish positive and negative values; make cube and axial coordinate values line up (as shown above) - Cube/hex animation diagram: changed animation to be physics-based, with cubes falling down instead of to the right; changed colors to match the colors of the rest of the hex diagrams; added a little "bump" to the animation to make it look like the cube is being dislodged from the larger structure
- Conversions pseudocode: changed the radio button for choosing the grid type so that you can click anywhere on the line (using the <label> tag)
- Neighbor diagrams: made mouseover on the code also highlight the diagram (previously mouseover on the diagram would highlight code but not vice versa)
- Diagonal neighbor diagram: made mouseover work (bidirectionally) (previously this diagram didn't have any mouseover), sharing code with the other neighbor diagrams
- Line drawing diagram: made the circles a little bit bigger; showed the value of N in the text
- Coordinate range diagram: showed the coordinates so that you can verify that the constraints hold; renamed from dx,dy,dz to x,y,z for consistency with other diagrams
- Intersecting range diagram: colored both center points instead of only one
- Obstacles section: annotated variables with types in the pseudocode
- Hex to pixel diagram: changed the code to show the matrix structure; added the matrix values; rotated the diagram to match the flat/pointy variant you've chosen for the pseudocode (previously the diagram wouldn't match)
- Pixel to hex diagram: choose flat/pointy, and see the diagram, code, and matrix match (previously the diagram didn't change to match); emphasized that pixel-to-hex inverts the hex-to-pixel matrix; made the code show the matrix structure
So you might be wondering, so what? These are all minor changes. I agree! Those of you writing games probably know this already: lots of tiny things make a difference in how a game feels. The same is true for these pages. Polish, iteration, and "juicing" all affect how the page feels. I'm trying to iterate more this year, making these kinds of changes and also improving the code so that I can make even more changes. I plan to continue making small improvements to the hex diagrams over the next few weeks: here and here.
Post a Comment