Using Vue with Canvas #
In my last post I had said I was trying out some libraries to automatically track dependencies for me. The one I'm playing with right now is Vue.js. It can track dependencies between data and the HTML/SVG elements. For example if I write SVG:
<circle :cx="center.x" :cy="center.y" r="30"/>
and I have it hooked up to data:
data: {
  center: {x: 100, y: 150}
}
then Vue will remember that the circle depends on those x and y properties. If I modify the data with center.x = 75; Vue will detect this and update the circle. This is quite convenient!
How I implement my interactive diagrams, part 2 #
In the last post I described how I structure my interactive diagrams and gave some examples. In this post I'll describe what I'd like to do for future diagrams.
When I started writing interactive diagrams I used d3.js, which is a great visualization toolkit. At the time I thought data visualization was the hardest part of what I was doing, and I needed a library for that. Since then, I've seen other libraries — React, Riot, Ember, Mithril, Intercooler, Marko, Vue, Aurelia, Ractive, Rax, Svelte, MobX, Moon, Dio, Etch, Hyperapp, S/Surplus, Preact, Polymer, lit-html, Elm, and many more — that have given me different ways to look at the problem. I've realized that the visualization isn't the hardest part of what I'm trying to do. There are two two big problems I want a library to help me with:
- How do I update the visualization?
- Which algorithms do I need to run again?
How I implement my interactive diagrams, part 1 #
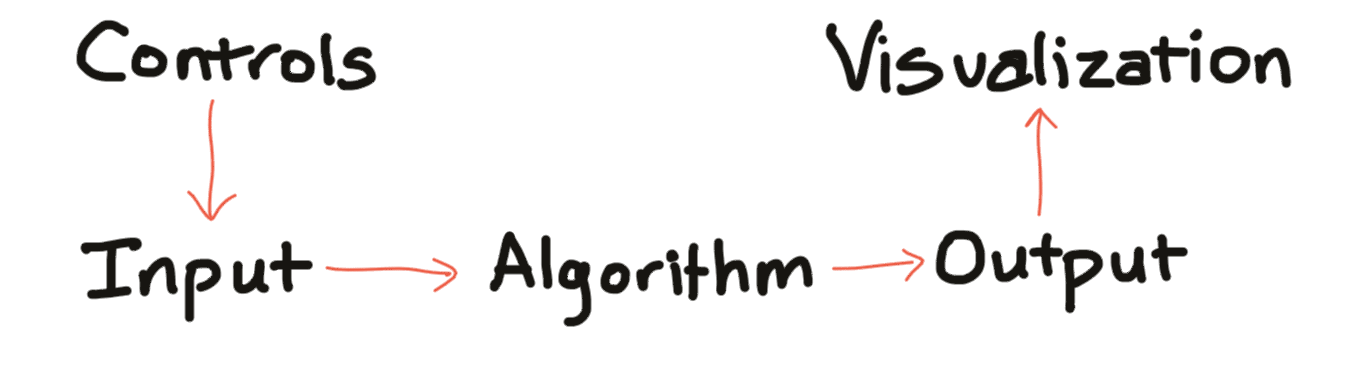
I have an interactive tutorial about making interactive tutorials, showing how I made my line drawing tutorial. I wanted to describe how I made interactive diagrams in several other pages. The flow is:
The controls and the visualization are what the user sees. The input, algorithm, and output are running behind the scenes.
Labels: making-of
Updating C++ code on the A* implementation page #
In my articles I have to make a tradeoff between making things approachable and including all the little details you might need in a real project. I tend to err on the side of making things approachable, but that means people can get frustrated when trying to translate these topics into real code.
For my A* pages I have a “theory” page that describes the main concepts but doesn't go into detail with code, and then I have a separate “implementation” page that shows more of the code. I included some C++ code that is abstract and reusable, but I've been unhappy with it. I decided to simplify it a little bit:
- I dropped the template parameter for
SimpleGraphbecause it's only ever used withchar. - Even though
Locationis a property of theGraph, the templated code for this is verbose and distracting so I madeLocationa separate template parameter. - I switched from
unordered_setandunordered_maptosetandmap; in practice you might prefer a hash table or an array, depending on the location type, but it's hard to pick one of these that's best for all cases. - I dropped some of the reference and const parameters.
- I switched from set.count() to set.find() to test membership.
- I wrote out explicit types instead of using
auto. - I used
std::xyzinstead ofusingto omit thestd::namespace.
I have mixed feelings about most of these, and went back and forth a few times before deciding I'm overthinking it and just going with my gut.
Before:
template<typename Graph>
void dijkstra_search
  (const Graph& graph,
   typename Graph::Location start,
   typename Graph::Location goal,
   unordered_map<typename Graph::Location, typename Graph::Location>& came_from,
   unordered_map<typename Graph::Location, double>& cost_so_far)
{
  typedef typename Graph::Location Location;
  PriorityQueue<Location, double> frontier;
  frontier.put(start, 0);

  came_from[start] = start;
  cost_so_far[start] = 0;

  while (!frontier.empty()) {
    auto current = frontier.get();

    if (current == goal) {
      break;
    }

    for (auto& next : graph.neighbors(current)) {
      double new_cost = cost_so_far[current] + graph.cost(current, next);
      if (!cost_so_far.count(next) || new_cost < cost_so_far[next]) {
        cost_so_far[next] = new_cost;
        came_from[next] = current;
        frontier.put(next, new_cost);
      }
    }
  }
}
After:
template<typename Location, typename Graph>
void dijkstra_search
  (Graph graph,
   Location start,
   Location goal,
   /* out */ std::map<Location, Location>& came_from,
   /* out */ std::map<Location, double>& cost_so_far)
{
  PriorityQueue<Location, double> frontier;
  frontier.put(start, 0);

  came_from[start] = start;
  cost_so_far[start] = 0;

  while (!frontier.empty()) {
    Location current = frontier.get();

    if (current == goal) {
      break;
    }

    for (Location next : graph.neighbors(current)) {
      double new_cost = cost_so_far[current] + graph.cost(current, next);
      if (cost_so_far.find(next) == cost_so_far.end()
          || new_cost < cost_so_far[next]) {
        cost_so_far[next] = new_cost;
        came_from[next] = current;
        frontier.put(next, new_cost);
      }
    }
  }
}
The code isn't as fast but I hope it's a little easier to read. I added a section at the end with the faster code.
My goal is to show how the algorithms work, and not to write reusable library code. That's not what I'm good at. Whenever I try to show code, I get into these messes. I hope the code I have is a reasonable starting point for anyone who's writing their own instead of using a library.
This year I'm trying to iterate more and publish things more often. Take a look at the updated A* implementation page and let me know what you think. I'll add suggestions to the Trello page.
Labels: pathfinding
Updating mapgen2 #
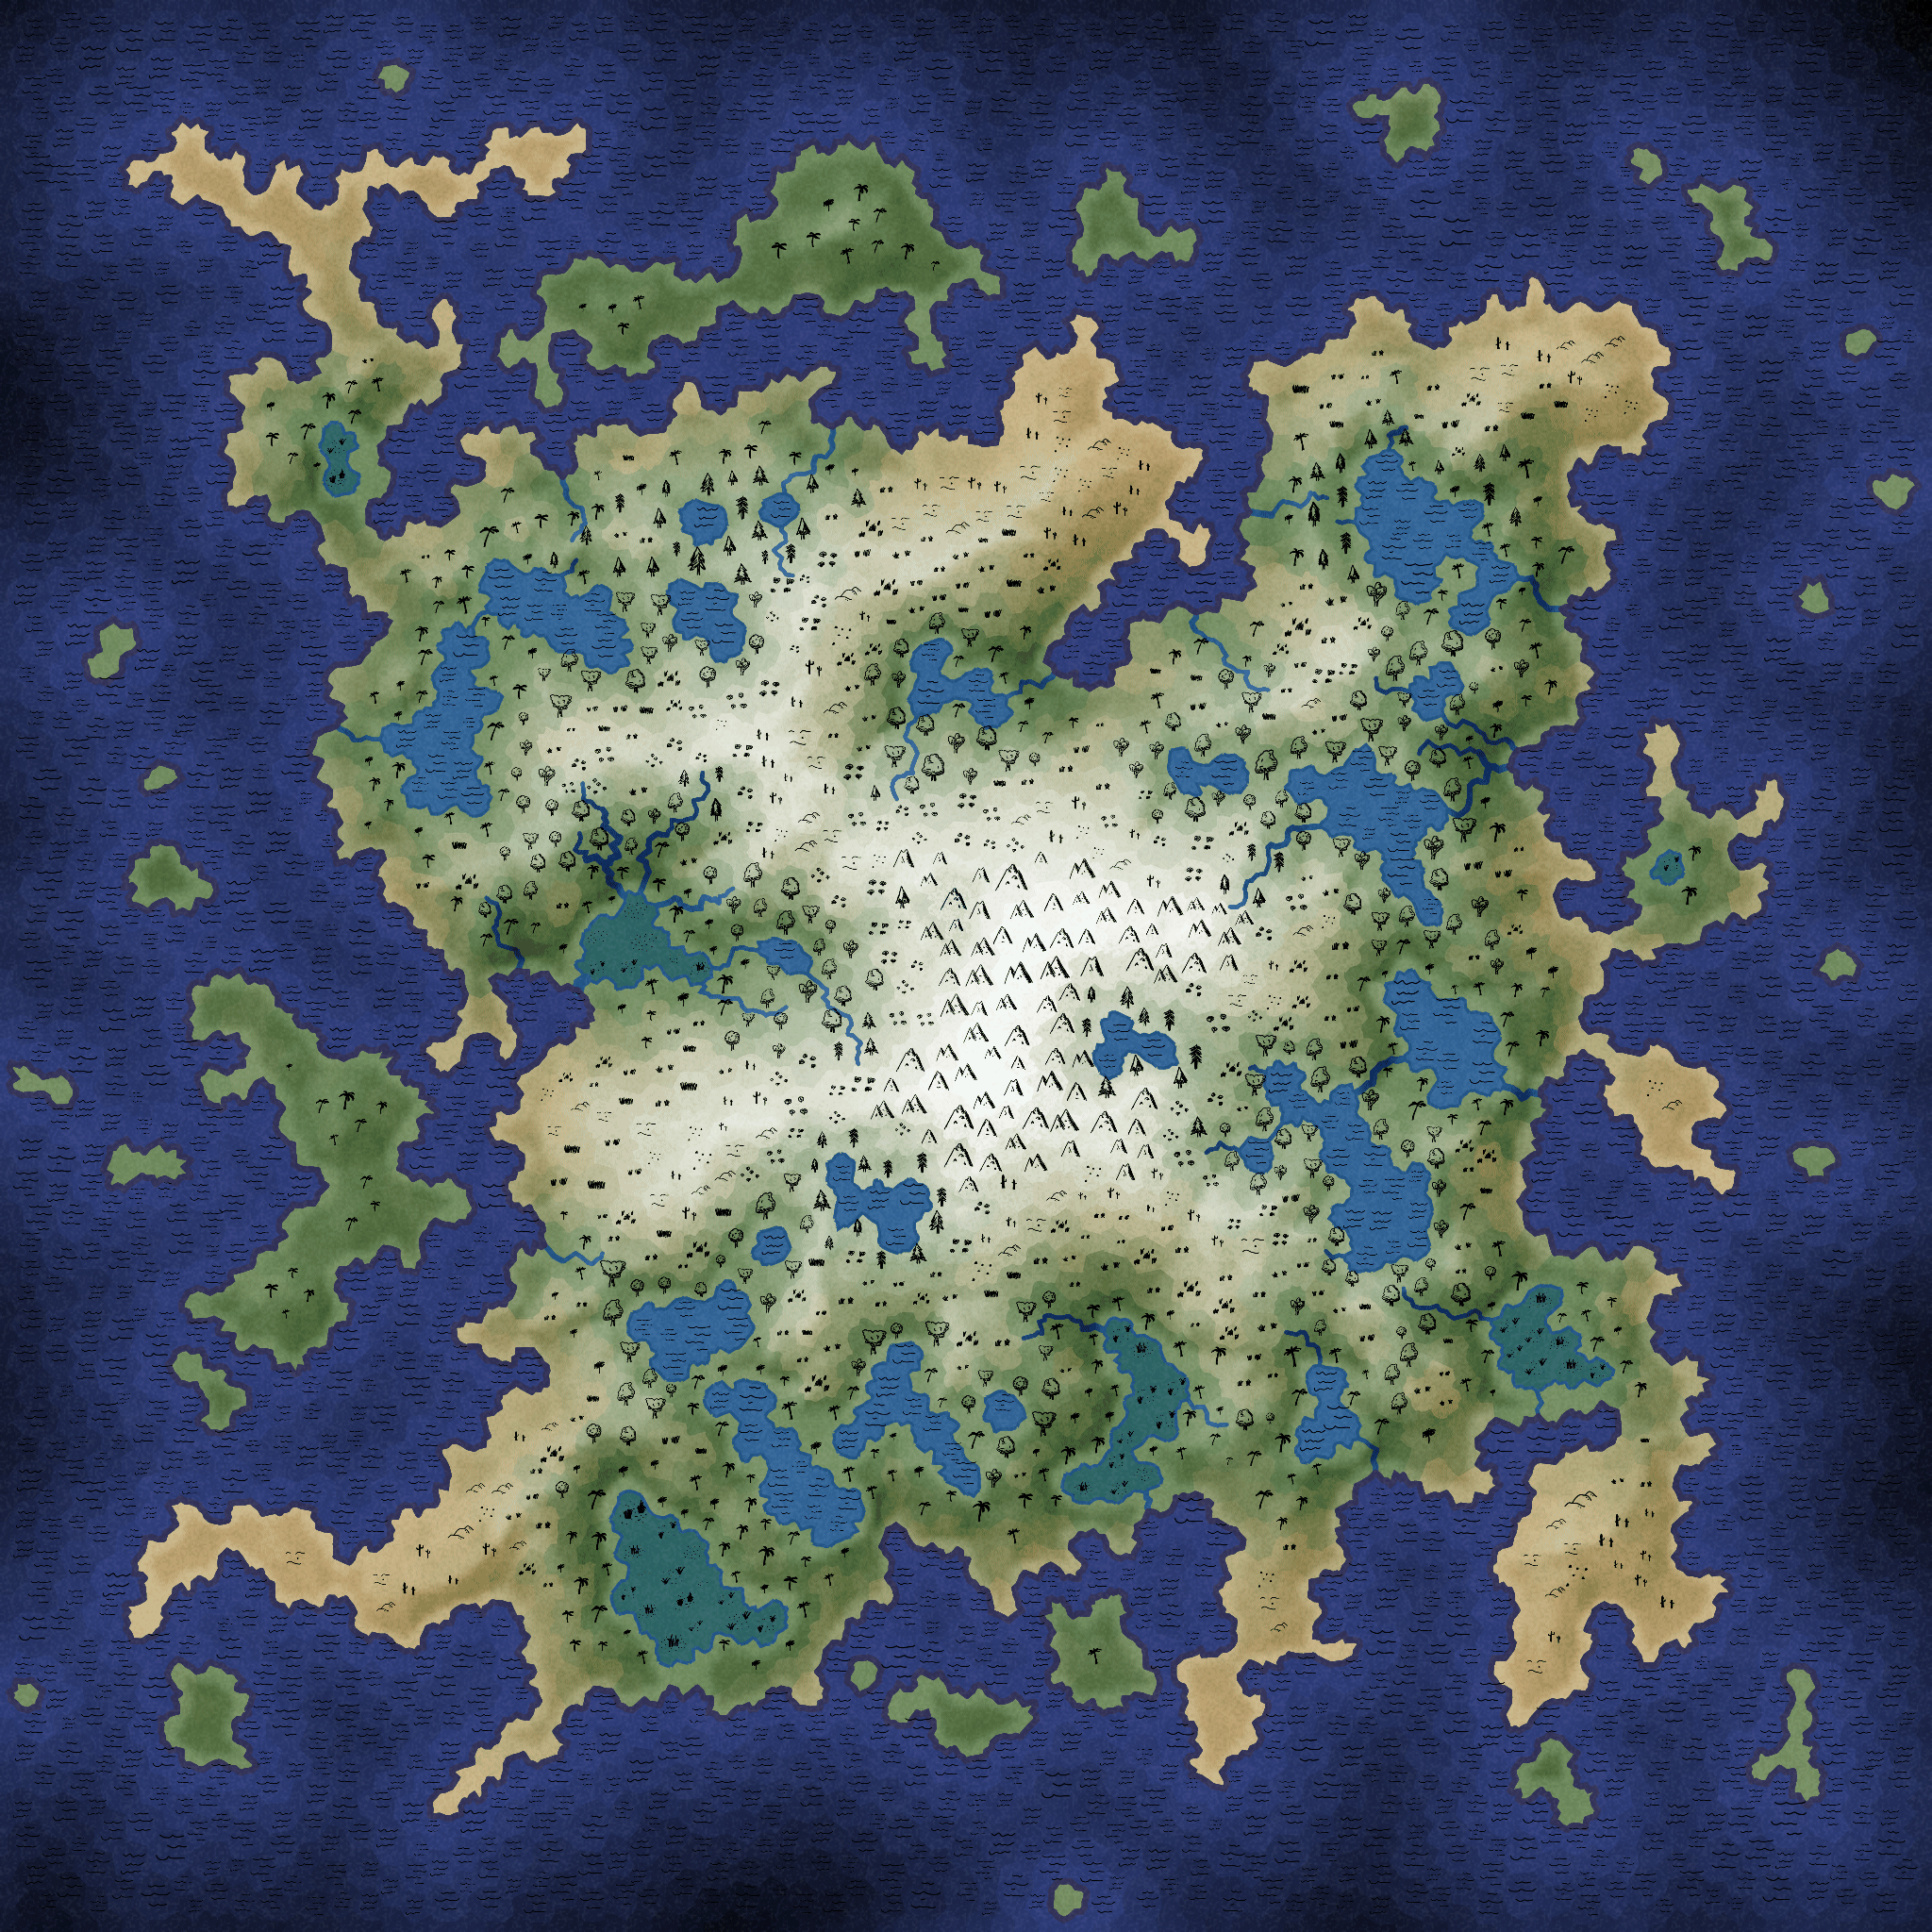
Back in 2010 when I wrote a procedural map generator based on Voronoi polygons instead of Perlin noise, the goal was to produce volcanic islands with a variety of monsters. I had started with Perlin-based height maps but got too much variety in the maps. I decided to use Perlin noise for deciding land vs water, but use other algorithms for everything else. I wanted the players to start on the beach and walk uphill, meeting other players who started elsewhere on the beach and were also walking uphill. I wanted to always produce islands with mountains in the center, so that the players on any beach would travel the same distance to get to the top. The maps were intentionally unrealistic but they were designed to satisfy the game design constraints. I made a Flash demo to accompany the article.
Labels: maps
Thinking about writing #
I'm looking again at traffic to my site and how I write. A few years ago I realized I had a "ratchet" problem. My first articles were less polished, and I felt good publishing them. When I got better at writing, my newer articles were more polished, but I would hesitate to publish. I didn't want to publish until I got everything just right. And as a result I've been publishing less and less the last few years.
Why didn't I want to publish until I got everything right? I didn't want a traffic spike to occur and for lots of people to see my unpolished page:

The trouble is that all the metrics shown in the charts make those traffic spikes look very important. But this cumulative sum chart makes those traffic spikes look unimportant:

The spikes feel good. HEY I got on reddit! But they don't seem that important in the grand scheme of things. Most of my visitors come from day to day visits, not from the spikes. And that means my trying to make sure everything's polished before I put it up may be unnecessary. A friend of mine says I should treat my pages like wikipedia. The cumulative traffic graph supports that.
A few years ago I gave myself an “out” by having "x" pages that were less polished. They were blog entries. They were “fire and forget” pages that I would publish, unpolished, and not update. It worked. I published a lot more. I really liked publishing every few weeks instead of every few months.
The trouble was that it was too easy of an out. I ended up publishing almost everything as "x" pages the last two years, and I think it took away from my regular pages. In particular, the "x" pages let me get away with not iterating. I didn't update them after I posted. And they didn't get better. And then they got very little traffic.
If my pages are like wikipedia I should be putting up incomplete unpolished pages earlier and then refining them over time.
So this year I want to publish more often but more importantly iterate more after I publish. I can treat the early viewers as beta testers. It's the “launch early” philosophy from startup culture (minimum viable product, etc.). I tell other people to do this but I haven't been practicing what I preached.
Take a look at my Trello page to see the kinds of things I want to work on.
Labels: making-of
What I did in 2017 #
What did I do in 2017? My plan, from my post a year ago, was:
- Help other people make interactive tutorials.
- Work on projects that lead to tutorials, instead of starting with the tutorials.
For the first goal:
- I met several people working on interactive tutorials / explorable explanations, and chatted with many more online. It was great to talk to other people making these kinds of tutorials!
- I was a mentor for Google Summer of Code, working with a student on interactive diagrams for Russell & Norvig's AI textbook, AI: A Modern Approach. He made the diagrams for chapter 3, chapter 4, and chapter 6. After the summer was over, I helped other students make diagrams for chapter 2, chapter 5, chapter 21, and chapter 22.
- I worked with a game developer on a tutorial (we didn't finish but I learned a lot)
- I made an interactive tutorial about making interactive tutorials, including a section on how to make “scrubbable” numbers like the ones in Bret Victor's Tangle library.
I'm pretty happy with how that went.
For the second goal:
- I worked on some small projects for Nonagon Games (including minimap-painter, some redis experiments, a serialization library, another map painter, a map renderer, resource placement)
- I worked on many procedural map generation experiments (for Nonagon Games, but also for a future tutorial)
- From these projects I wrote a dual mesh data structure library, added a setction about ridges to one of my tutorial pages, and made an HTML5 version of my polygon map generator.
Although I did work on many small projects, I didn't work on any big projects. I have mixed feelings about this.
Other things:
- I moved my site to a cheaper, faster web server
- I converted my site to https, which was quite a bit more complicated than I thought it would be
- I converted over 500 of my web pages from fixed width layouts to “responsive design”, and wrote an article about how it works ; it was a bit harder for my two column layouts
- I made incremental improvements to most of my web pages (wording, diagrams, interaction, etc.)
- I spent way too much time studying the color yellow
- I made a tool to turn an image into a polygon mesh, originally intended for map generation (you'd paint a map in MS Paint and then turn it into polygons) but more fun as an art tool
- I occasionally answered questions on stack overflow or reddit with interactive demos like this and this and this
- I made a creepy procedural animation of a bacterial cell
- I tracked these things on my trello page
What do I want to do in 2018?
- I learned a lot from my map experiments this year, and I'd like to produce some useful tutorials and demos from them. Several techniques could be added to the existing map generator.
- From working with others I was reminded how valuable iteration is. I want to go back to my older tutorials and update them.
- I want to continue working with game developers on algorithms that could turn into future tutorials.
- I want to write a tutorial on coordinate systems and cameras. I've tried this before but maybe the third time's the charm?
- I'd like to write a few more tutorials about writing interactive tutorials.
- I want to become faster at writing tutorials. Part of this is managing scope but part of it is using better libraries that let me reinvent less each time.
Labels: annual-review
Website updates, part 2 #
In my last post I said I was going to update my website layout. I've been working on it for the past three weeks . The main change is responsive design: the page will adapt somewhat to the size of the browser window, including phone and tablet sizes.
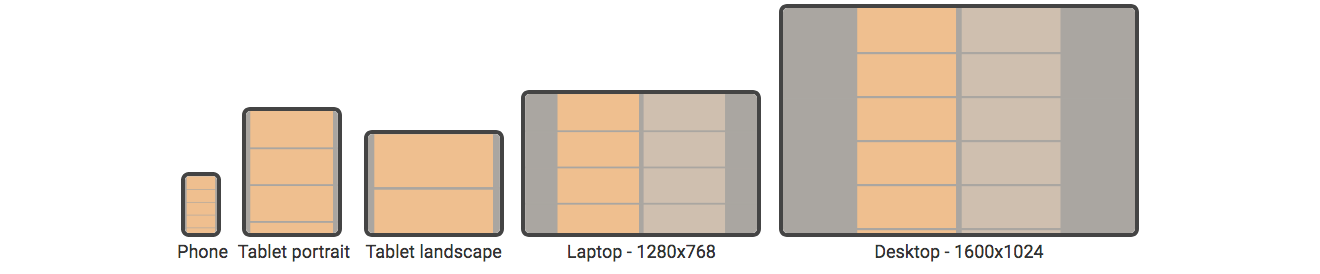
Of approximately 600 web pages, I have 514 converted to the new layout. The rest are either unimportant or impractical to convert.
To help myself understand the issues, I made some diagrams:
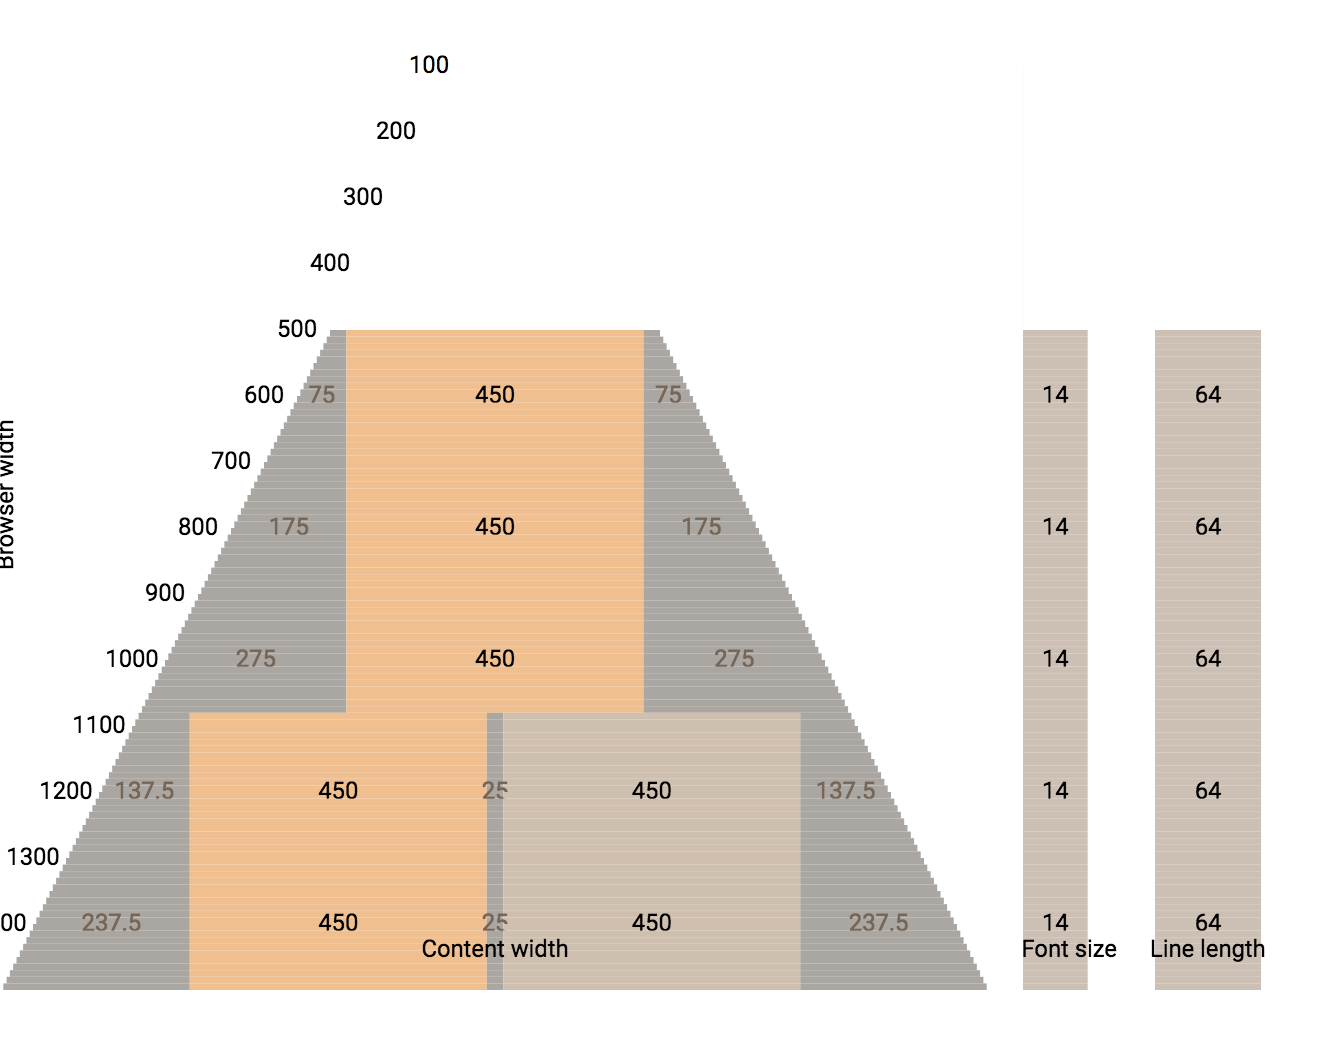
I wrote up my notes about how I made the pages responsive.
I also fixed some glitches on my pages, and switched from downloaded fonts to system fonts (to make the page load faster).
For testing, Firefox's screenshotting tool and Chrome's screenshotting tool were both useful. I took screenshots before and after a change, and then reviewed the pages when screenshots changed.
# Firefox
/path/to/firefox \
    -screenshot \
    --window-size=$width,4000 "$url"

# Chrome
 /path/to/chrome \
     --headless --disable-gpu \
     --window-size=$width,4000 \
     --screenshot "$url"
Labels: design , infrastructure
Website updates, part 1 #
For the most part my website setup has been the same since 2011 when I launched www.redblobgames.com. It's a static site served by nginx. I'm currently working on two updates:
- I'm (finally) setting up https. This has been more of a pain than I expected.
I think I have OSCP working. I didn't set up ECDHE but may have that. I didn't set up DHE or ECDH. No POODLE or BEAST. Somehow got P-256. I have PFS. I'll do HSTS later. Didn't set up HPKP but it may be obsolete anyway. Can't set up CAA with my DNS provider. No RC4. I have ALPN, NPN. I have CORS. Don't need SRI. I have XFO and XXSS. I have CSP but don't like it.
I have acronym overload.
I'm also updating my internal links to link to the https version.
- I'm (finally) learning responsive design.
I have pages going back
2722 years and I've been making layout changes less and less often. Every time I change something it takes a while to go back through all my pages to make sure it works on all of them.My older pages like polygon map generation are designed for a
400450 pixel width. I had designed that layout to support desktop computers back in the 1990s. As I worked on more visual pages the400450 pixel width seemed limiting so I designed newer pages for 600 pixels. For mobile, I told the phone to treat the page as 640 pixels wide, and scale it to fit. I haven't updated that layout in years. I experimented with wider layouts for the probability page and the hexagon page (both pages switch to a two column layout when the browser is wide enough) but for the most part I've tried to stick to the 600 pixel width. It's simple. It works.In the past few years browsers have quickly added features like flexbox, grids, calc(), scaling of images, and high-dpi. I've seen some neat layouts using these features, and it would let me do several things I've wanted to do but couldn't figure out. I want more flexibility in my page design than a single 600 pixel column. Lots to learn!
I'm also strongly considering dropping custom fonts. I don't think they're adding that much right now, and they slow down page loading. I'm also considering using serif. Back in the 1990s serif fonts were a poor choice, as screen resolutions weren't high enough to render them nicely. But today? After a decade of 1024x768 there's been a sudden increase in screen resolutions / density, so I should consider serif fonts.
Labels: infrastructure
Polygonal Map Generation, HTML5 version #
Seven years ago I worked on an terrain generator for a game called Realm of the Mad God. We had started out using Perlin Noise for height maps but found that most of the maps we generated weren't a good fit for the game. I spent the summer trying out ideas for making the maps, and discovered that Voronoi Diagrams could form a good “skeleton” for making maps. The combination of Voronoi polygons and Delaunay triangles gave me places for quests, towns, rivers, and roads. I used Perlin Noise for the coastlines instead of for the height map. The resulting maps were unrealistic and inflexible but they were just what we needed for our game.
I'm a fan of sharing math and algorithms so I wrote up my notes in an article titled Polygonal Map Generation, along with a free online demo written in Flash. The response was amazing! I saw lots of projects trying out Voronoi diagrams for their own map generators, and I also saw lots of people using my Flash version to make maps for things like D&D campaigns, stories, and worldmaking.
A year later I decided I should spend a lot more time making interactive tutorials, so I started Red Blob Games, where I've written interactive tutorials on probability, pathfinding, and hexagons.
It's been seven years since I worked on the map generator. I decided I should spend this summer exploring terrain generation algorithms, revisiting the topics I explored in 2010 and expanding on them. I posted these notes:
- Voronoi alternative - I discovered that my map generator from 2010 wasn't actually using Voronoi! I had been using Voronoi during the summer while working on the generator and also while writing the tutorial, but towards the end I tweaked the polygons to improve the rivers, and in doing so I was no longer using Voronoi.
- Triangle meshes - In 2010 I had used an array-of-structs approach to storing the map data, with an explicit graph structure. It used approximately 2700 bytes per triangle. After watching Gino van den Bergen’s GDC 2017 talk, “B-rep for Triangle Meshes”, I learned about more efficient data structures, and wrote one that uses approximately 27 bytes per triangle. That's a 99% savings! I also learned how to eliminate a common source of errors in my 2010 code: edge cases (literally). By wrapping the map around the "back", I can get rid of all the null pointers in the data structure, and the code became much cleaner.
- Procedural river drainage basins - Part one - I had found a cool paper that described making rivers first and then making mountains to match the needs of the rivers. I wanted to try this out! I spent a week playing with rivers and drainage basins.
- Elevation from rivers - Part two - making the mountains. I ran into some issues that were mentioned in the paper but I wasn't able to come up with a solution within my one week self-imposed deadline.
- Procedural elevation - Part three - still trying to make mountains, I decided to give myself another week. In working on this I realized I've been pursuing all of this because it sounded cool instead of trying to solve the problem I actually had. I stopped pursuing the mountains-from-rivers approach.
- Elevation control - One of the problems I was actually trying to solve is giving the level designer some way to influence the terrain generator. I spent a week playing with some simple algorithms, and found something extremely simple and fast.
- Adding details to sketched terrain - In the previous week I had found something I liked a lot, and I wanted to see if I could hook it up to the mountains-from-rivers algorithms. It was kind of cool but not cool enough that I wanted to pursue it.
- Terrain shader experiments - I took a break from terrain generation to play with shaders. I wanted to see whether shaders could be useful for drawing the boundaries between the Voronoi polygons. Using barycentric coordinates, I got some cool effects, but the only one that was simpler with shaders than without was noisy boundaries.
Having time to experiment was great. I learned a lot. I wrote lots of quick & dirty code, most of which I'll never use again. A few parts of it I want to use for future projects, so I went through those parts and cleaned up the code, ran some automated tests, and then improved the design and usability.
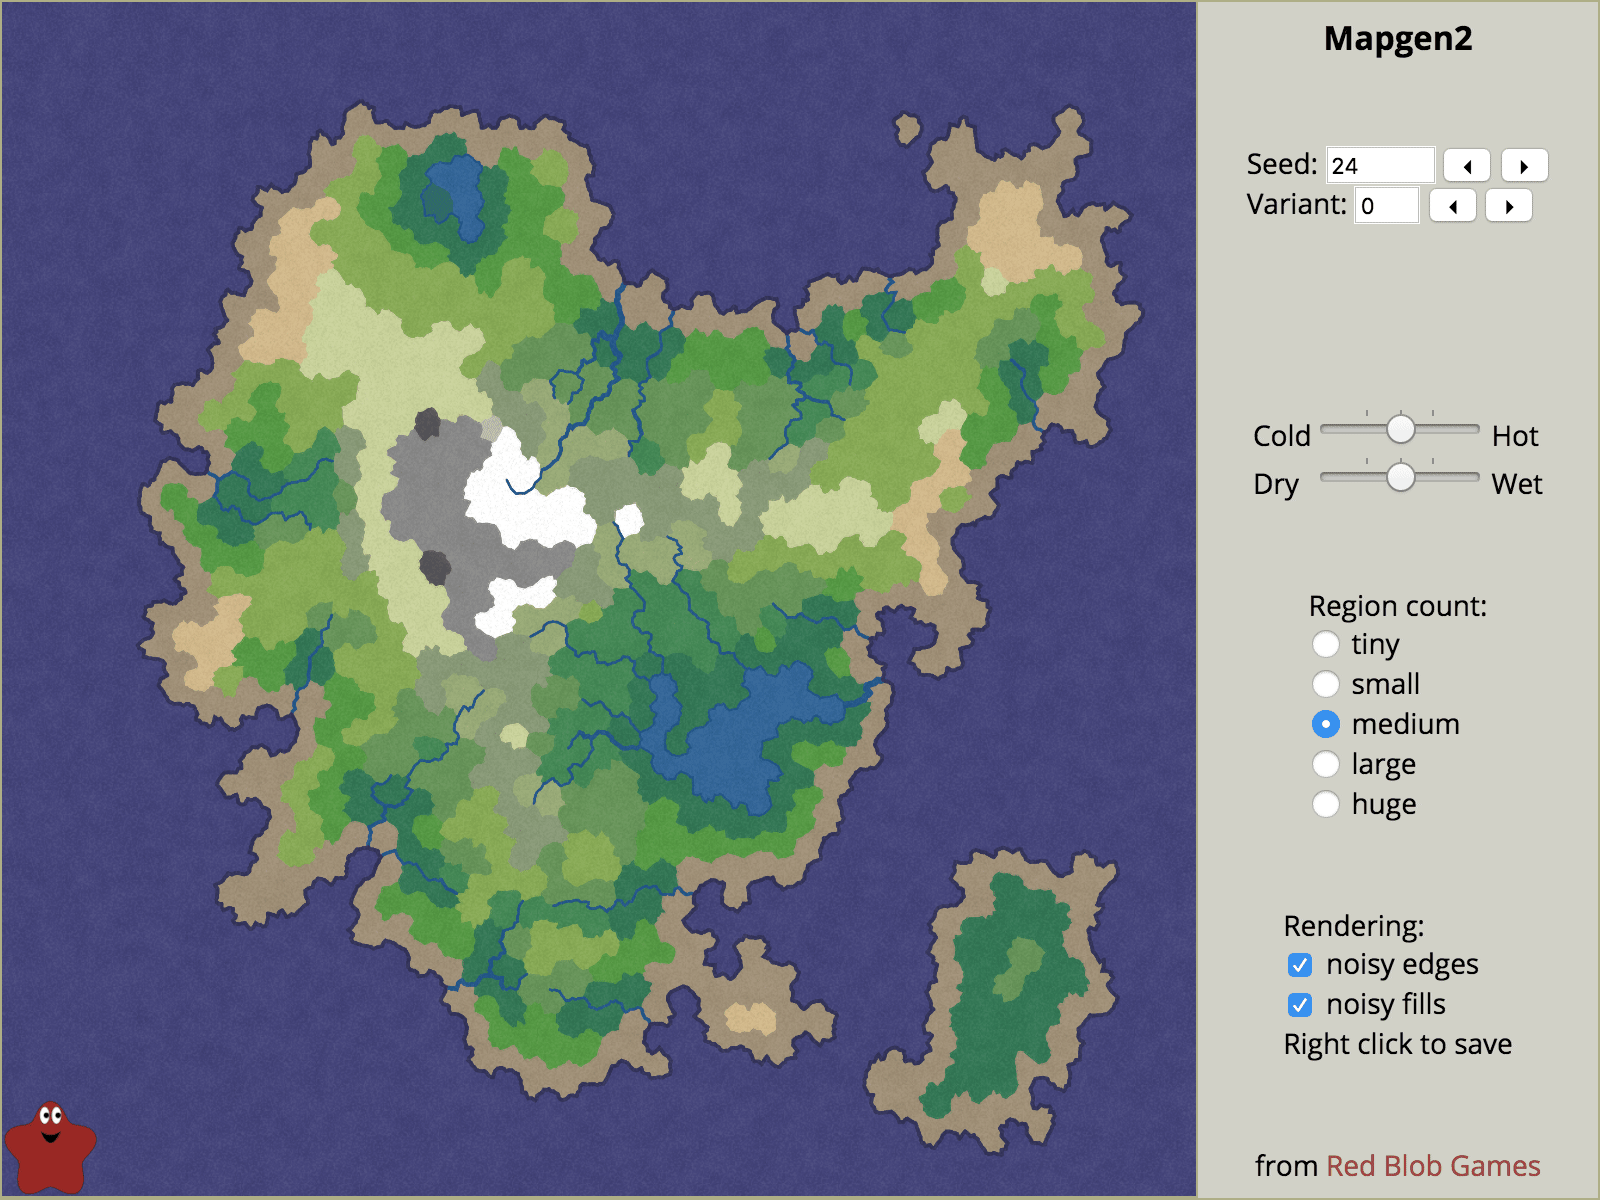
One of the things I've been wanting to do for some time is rewrite the tutorial with interactive diagrams, and reimplement the 2010 map generator from Flash to HTML5. Back then, Flash was a reasonable choice, but not so much today. I spent a few weeks on the tutorial but was unhappy with the way it was going, so I put it on hold. I worked on an HTML5 version of the map generator instead. It doesn't have all the features of the Flash version, but it has some features the Flash version didn't have. It's much faster too.
I'd like to get back to the tutorial, but I think it'll be more compelling once I have some new algorithms to share.