What I did in 2019 #
It's time for my annual self review. You can see previous ones from 2015, 2016, 2017, 2018. I didn't have a lot of goals for this year:
- Write to my blog instead of only to Twitter or other closed platforms.
- Improve my explanations and write new ones.
Labels: annual-review
Experimenting with outlines #
I posted recently about how I often do one-week projects to learn and experiment. I don't have a strict one-week time limit. Sometimes I'll extend a project or come back to it after I've learned something new.
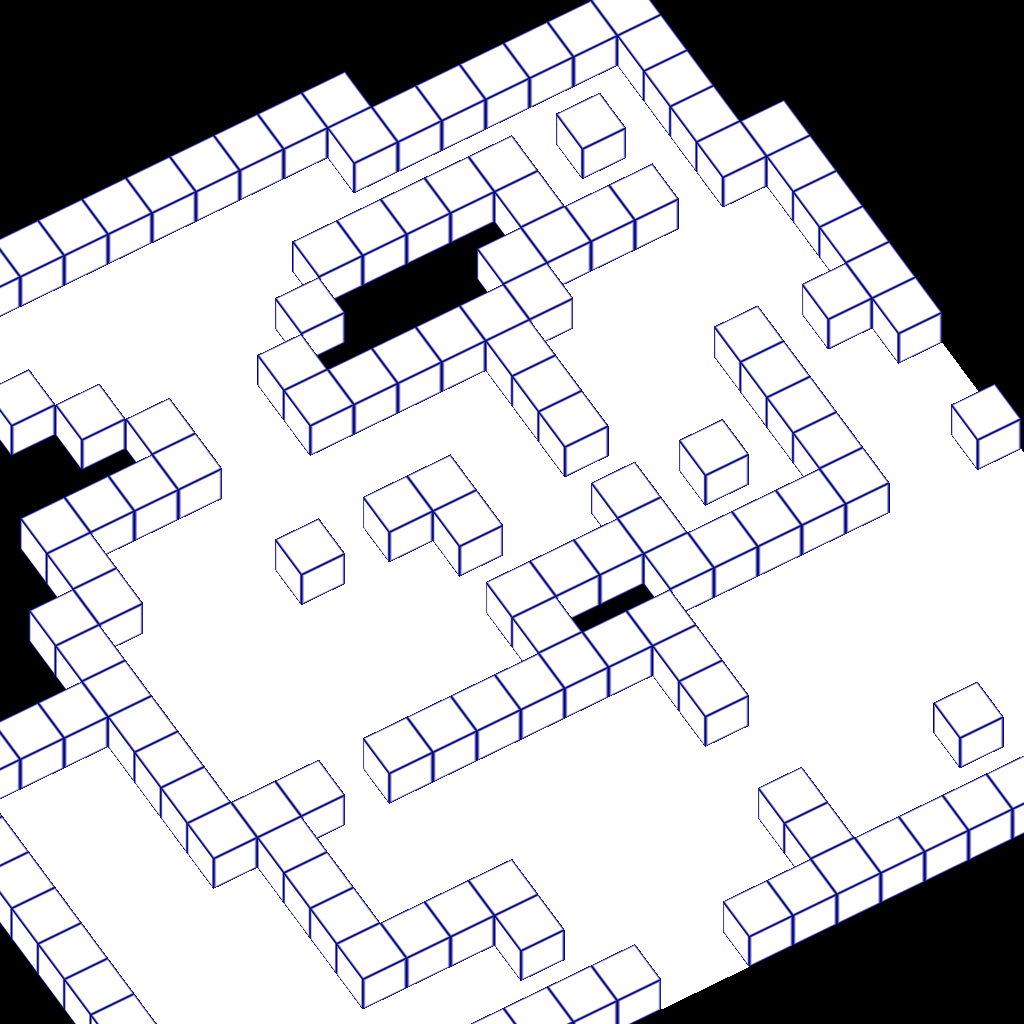
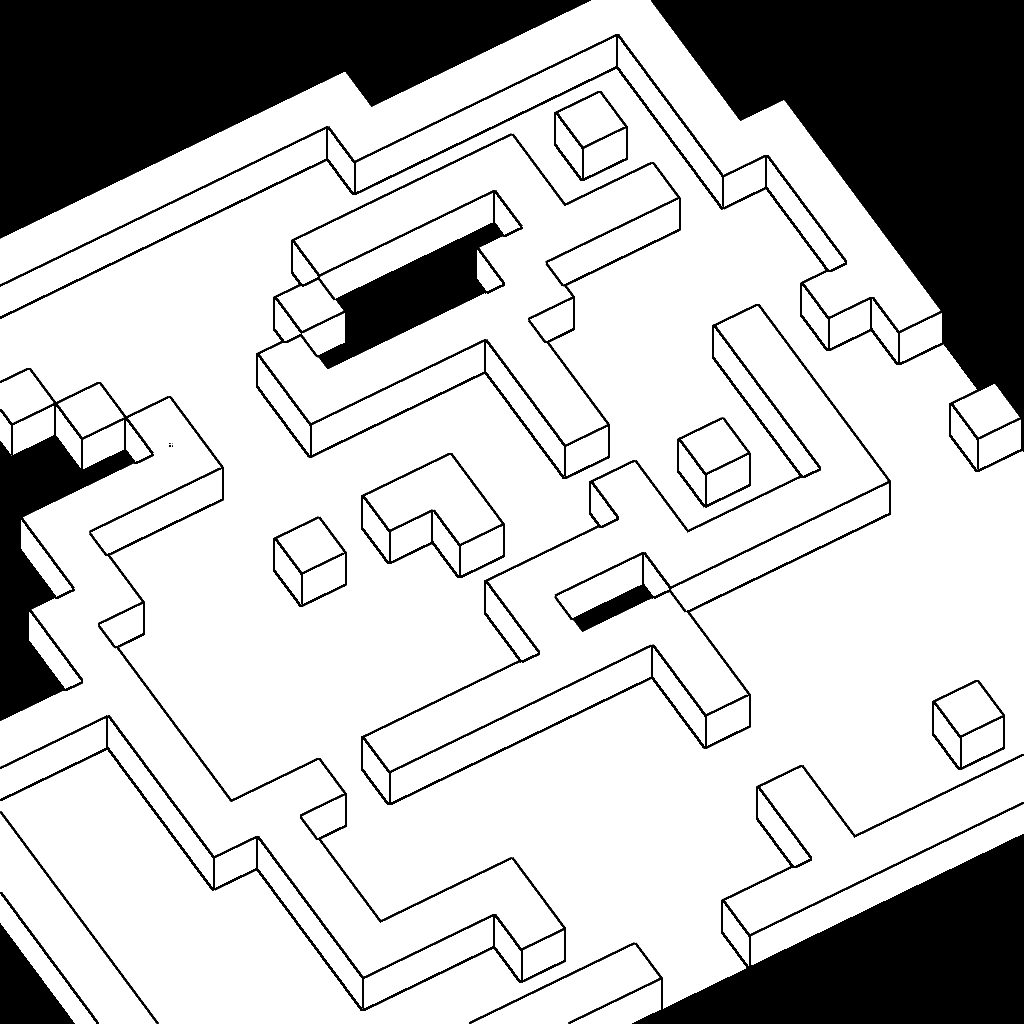
Ten weeks ago I had a one-week project in which I wanted to draw outlines on an isometric view of a dungeon game. I didn't want to outline each block, which could be implemented easily by editing the sprites. Instead, I wanted to outline the larger units. Here's a comparison:
Labels: graphics
Fun art projects #
I've not been in the mood to write articles lately, so instead I've been working on some fun projects instead. Watabou posted about Dyson Hatching, which got me thinking it might be interesting to constrain the hatch lines to Voronoi cells. I implemented that and then got carried away with colors, line spacing, line width, and other fun things. The demo is here. You can drag an image onto the diagram to use the colors from your image.

Types of projects #
When I started writing articles on my site, sometimes I had great results, like writing the hexagonal grid guide in 6 weeks, and sometimes I had terrible results, like writing article about curved roads in 5 months. I eventually realized that the difference was that with hexagons, I understood the topic well, but with curved paths, I spent most of the time trying to understand the topic. To make matters worse, because I had a high standard for my articles, I spent too much time trying to polish the article about curved paths, even before I understood it well.
Back in 2013 I decided to create a separate directory /x/YYWW-name/ where I'd put the lower effort and experimental pages, numbered by year and week. For example, 1942-isometric means year 2019, week 42. Over the last few years I've realized I do two different types of projects:
Curved region rendering #
Around a month ago I had an idea in my head: a voronoi grid modified to have rounded cells that change in size. I made an attempt here for single cells changing size. The next step was to merge cells together, as I had done on this project. I decided that the way to demo this would be to simulate some kind of belief/cultural systems that spread over time across a map. I tried this here.

Labels: triangles
Procedurally generated annotations #
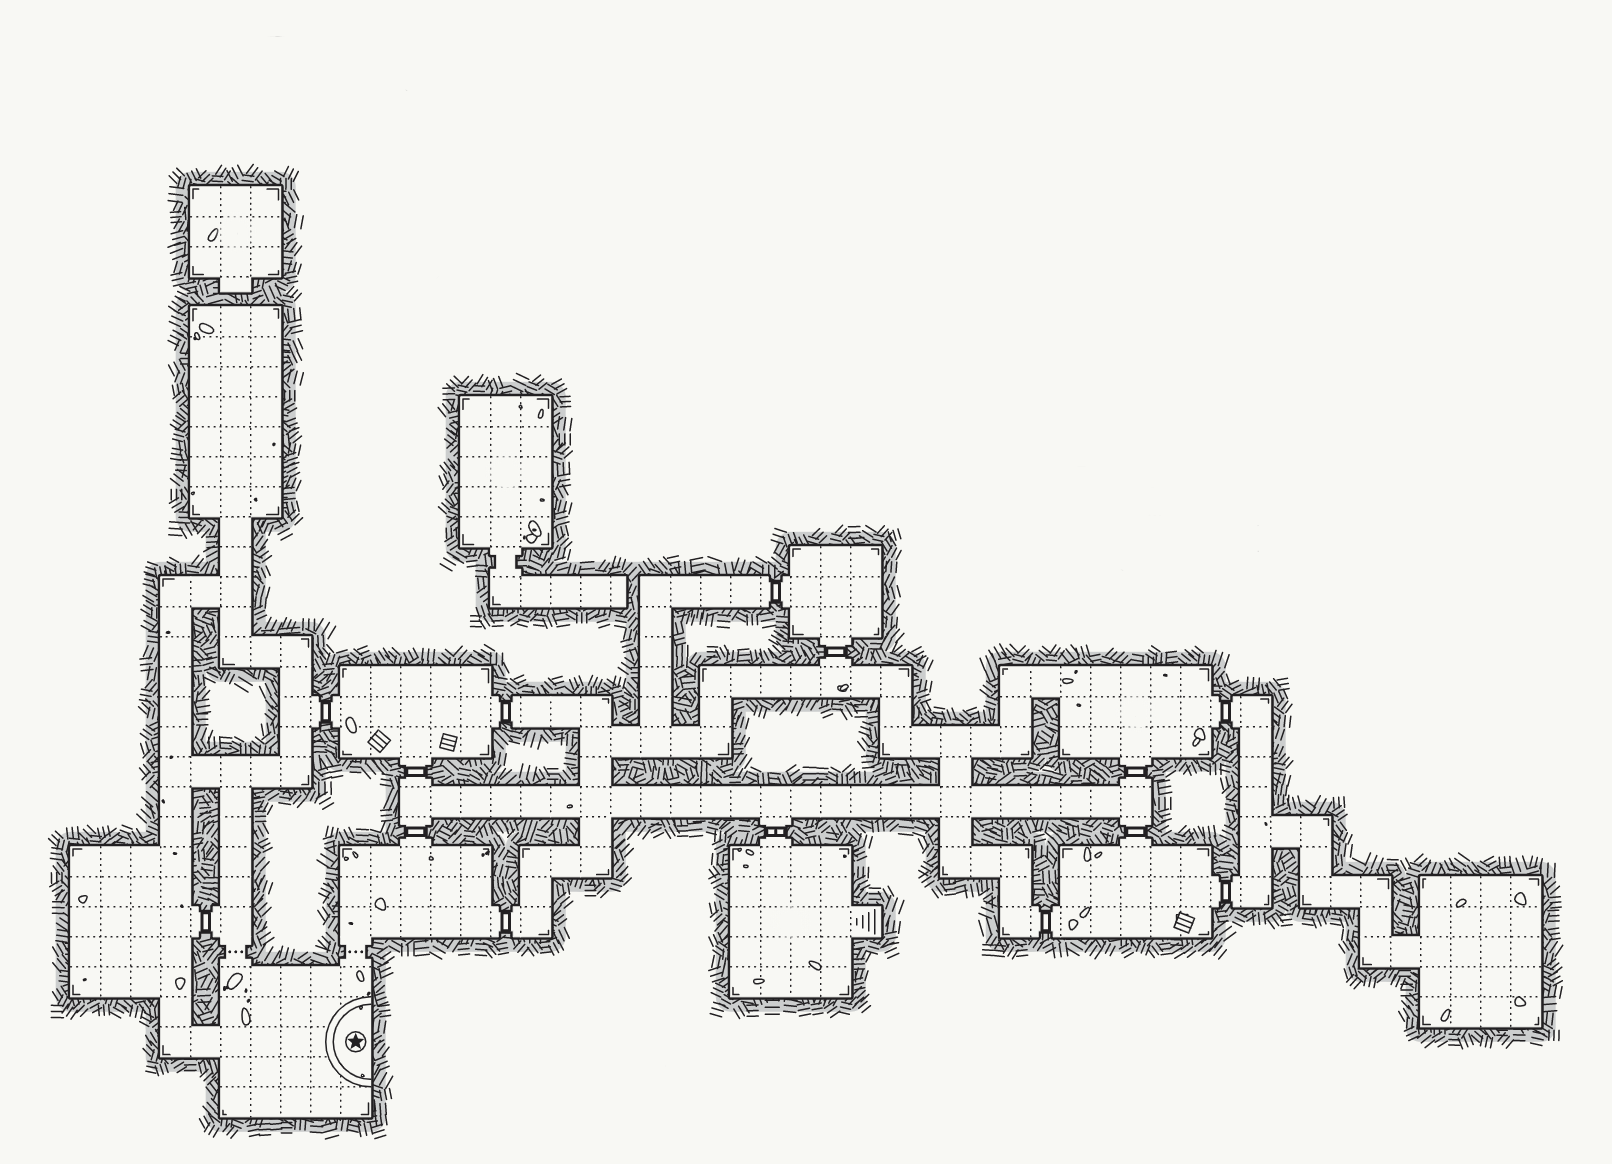
Imagine exploring this dungeon:
Labels: maps
Chaikin Curves #
Sometimes I want to draw Voronoi or similar polygons in a rounded form:
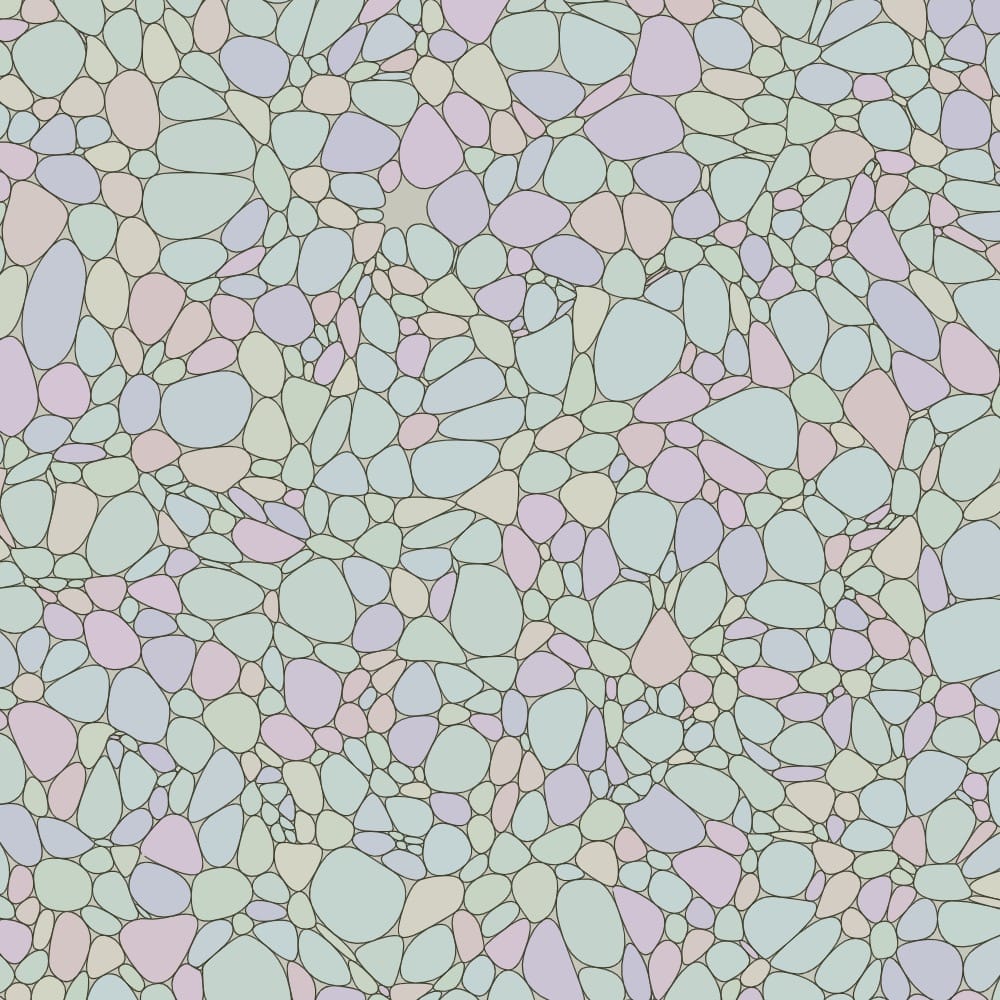
I use a process called Chaikin's Algorithm for this.
Labels: geometry
Verb-noun vs noun-verb #
I went to the Roguelike Celebration over the weekend and enjoyed Thomas Biskup's talk about Ultimate ADOM. Among the many interface improvements they're making based on user testing is they're simplifying the controls from the traditional roguelike controls to W A S D + E F. I don't know how roguelike game players will respond to that but I'm a fan! This reminded me of two things from my past, so I thought I'd say a little about those.
Labels: structure
Square tiling of a sphere, part 3/3 #
In the previous post I described how I learned about the cube/sphere geometry so that I could put a square grid on a sphere. I ended up spending too much time on that, because it turns out the mapping from cube to sphere wasn't as useful as I had thought. This happens to me sometimes, where I find something fascinating, spend a lot of time on it, and it turns out to be not that important.
As the final step in learning how to work with square tiles on a sphere, I wanted to make something on the sphere. I decided to make a dungeon map.

Square tiling of a sphere, part 2/3 #
In the previous post I described how I learned about HEALPix because I wanted to try covering a sphere with square tiles for a game map. During that exploration I realized that HEALPix with 12 square regions is similar to cubes with 6 square regions, but HEALPix has some nice properties for numerical calculations such as spherical harmonics. I don't need those properties. Instead, I am looking for something that's simpler to program, so I explored cubes.
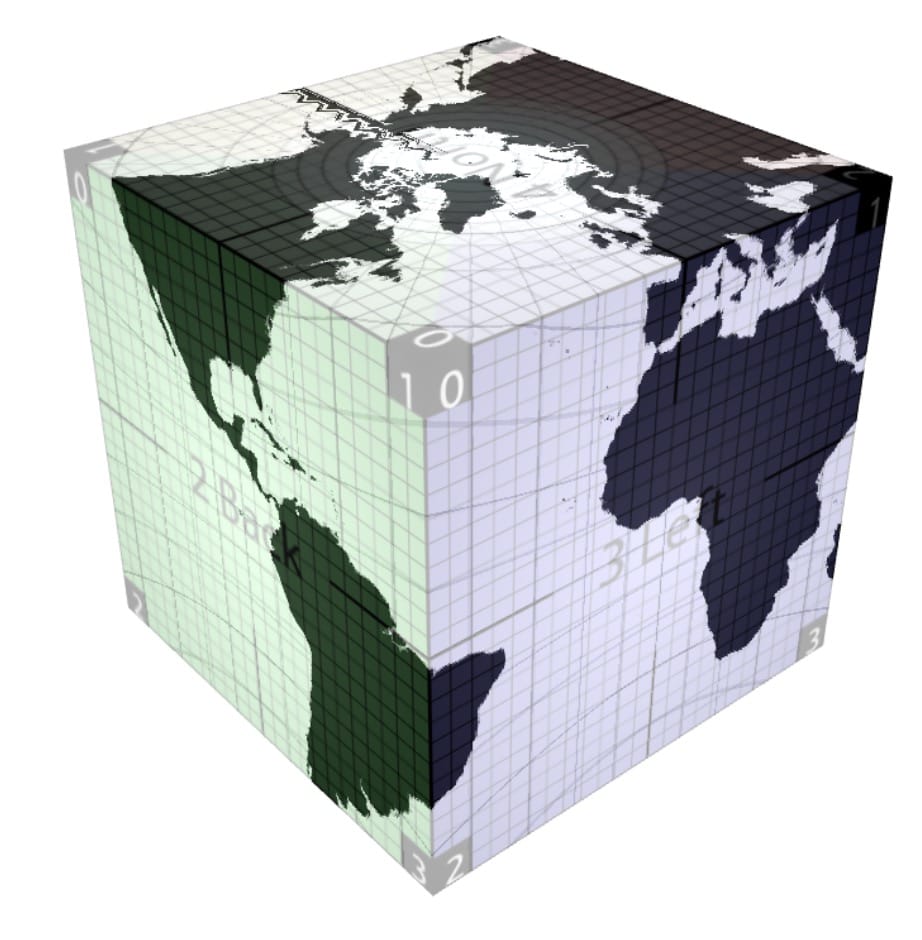
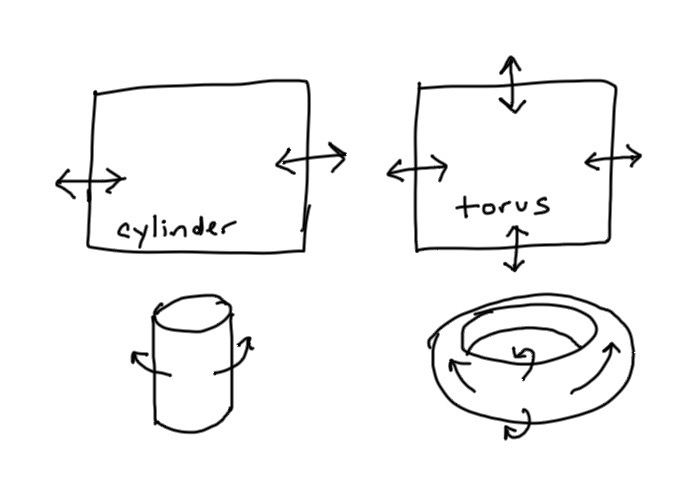
The goal is the same: I want to play a game on a flat top-down tile map (roguelikes, Dwarf Fortress, Factorio, etc.), but these games have one of three approaches to the map:
Square tiling of a sphere, part 1/3 #
I almost always work on 2D game maps, but occasionally I get intrigued by planetary maps. I'd like to make a planet that uses a grid. The topology of a sphere requires a few things:
- Moving east or west you eventually wrap around the world → easy
- Moving north/south you eventually reach a pole, and then all directions are south/north → medium
- Wrapping around the world east/west is shorter near the poles than near the equator → hard
Coordinate transforms, still #
Last post was about my attempt at explaining coordinate transforms. Progress has been slow. I've implemented many of the diagrams but I'm still having trouble with the narrative. Last time I said this was my outline:
- Show a side scrolling game with some cool camera effects.
- Introduce world coordinates vs screen coordinates.
- Solve the problem of scrolling: subtract an offset.
- Introduce transforms. (may need to be later)
- Introduce inverse transforms, for mouse clicks. (may need to be later)
- Introduce cameras. More complicated than offsets, but can do more.
- Show some cool effects with cameras. (may need to be earlier)
- Introduce chaining transforms.
- Show some cool effects with chaining.
- Demo showing all concepts together.
I've been experimenting with different orders for the topics and now think there are two intertwined “tracks”: the concept track introduces mathematical concepts and terminology, and the problem solving track shows solutions to specific gamedev problems. These two tracks are paired up:
| Problem solving | Concept |
|---|---|
| scrolling | world/screen coordinates, translate transform |
| following the player | cameras, view coordinates |
| tile grid coordinates | scale transform, chaining transforms |
| mouse clicks | inverse transforms |
| ? | function composition |
| ? | transform matrices |
I think in each case I should start with the problem to be solved, then show the immediate solution, then explain the concept behind the solution. The concepts then lead to a reusable solution. Example:
- Problem: we want to scroll the screen
- Immediate solution: add an offset before drawing
- Concept: we're transforming world coordinates to screen coordinates
- Reusable solution: a translate transform is a function or object that converts coordinates
The next section is:
- Problem: we want to keep the player in the center of the screen
- Immediate solution: use the player plus half the screen size as the offset
- Concept: a "camera" points at the player, using view coordinates
- Reusable solution: a camera object is placed in the world, and we use that to build the translate transform
What order should I present these topics? I'm not sure. I know I want to put scrolling first. If I put mouse clicks second, then it's fairly easy to solve, and there's less motivation to learn inverse transforms. So I might put that later. If I put tile grid coordinates second, then it leads to chaining transforms together, which will be useful for following the player with a camera. Or if I put following the player second, then it leads to view coordinates, which might further motivate chaining transforms.
I think the main problem is that I'm not feeling particularly inspired right now, so I'm working very slowly.
Coordinate transforms, again #
Back in 2015, I had attempted to explain coordinate transforms in terms of matrices. In 2016, I started over, trying to focus on coordinate transforms without matrices. That didn't work the way I wanted either, and I wrote a blog post about that, saying that I was going to focus on game cameras. I started that, but lost motivation. The last line of that blog post is: Well, I failed. I lost motivation to work on this so I've put it on hold … again. I think I may take a long break from tutorials.
Reader experience with 404s #
There are many days when I don't feel like working on my project. I use this feeling to "productively procrastinate" on things that I've been wanting to do but haven't done yet. Earlier this week I decided to tackle two related problems:
- I want to know which pages are reachable from the home page. I can then review the ones that aren't reachable and consider adding them if they're finished.
- I want to make suggestions on the 404 page, but only to pages that are reachable from the home page. There are a whole bunch of random pages I have that aren't finished or useful, and I don't want to use those for suggestions.
Little details #
On each of my pages you'll notice the main element: interactive diagrams that visually explain a concept. But there are lots of other techniques I use too. Unfortunately, I don't remember all of these when I'm writing a new page. I decided to make a catalog of things I've used so that I can remember to use them on the new pages I write.
I've been working on this for a few months and it's still incomplete but I decided I should share it: https://www.redblobgames.com/making-of/little-things/
Are there other little details on my pages that I've forgotten about? Probably! I will update the document as I think of them.
Labels: making-of
Brainstorming with reversal #
In the previous two posts I described how I sometimes approach a problem by trying to arrange it into a matrix. Sometimes that doesn't work and I instead try to look at the problem backwards. As an example, consider procedural map generation. I often start with a noise function, adding octaves, adjusting parameters, and adding layers. I'm doing this because I'm looking for maps with certain properties.
Brainstorming with factoring #
In the last post I described how I sometimes describe a problem with a matrix, and then look at the matrix transpose to see if it gives me new ideas. Another technique I use is to look for a factoring.
In algebra, factoring transforms a polynomial like 5x² + 8x - 21 into (x + 3)·(5x - 7). To solve 5x² + 8x - 21 = 0, we can first factor into (x + 3)·(5x - 7) = 0. Then we say that x + 3 = 0 or 5x - 7 = 0. Factoring turns a problem into several easier problems.
| x | 3 | |
|---|---|---|
| 5x | 5x² | 15x |
| -7 | -7x | -21 |
Let's look at an example: I have six classes, File, EncryptedFile, GzipFile, EncryptedGzipFile, BzipFile, EncryptedBzipFile. I can factor these into a matrix:
Brainstorming with transpose #
Sometimes I get stuck and look for a way to think about a problem a different way. There are some problems that you can view in the form of a matrix/table. The structure looks like this:
| A | B | C | D | E | |
|---|---|---|---|---|---|
| 1 | A1 | B1 | C1 | D1 | E1 |
| 2 | A2 | B2 | C2 | D2 | E2 |
| 3 | A3 | B3 | C3 | D3 | E3 |
| 4 | A4 | B4 | C4 | D4 | E4 |
| 5 | A5 | B5 | C5 | D5 | E5 |
There are rows and columns, and I'm trying to work on the cells. Let's try an example from a simple game:
| Attack | Defend | Special | |
|---|---|---|---|
| Fighter | sword | armor | slam |
| Mage | fireball | reflect | freeze |
| Thief | dagger | dodge | disarm |
Improving hexagon map storage diagram #
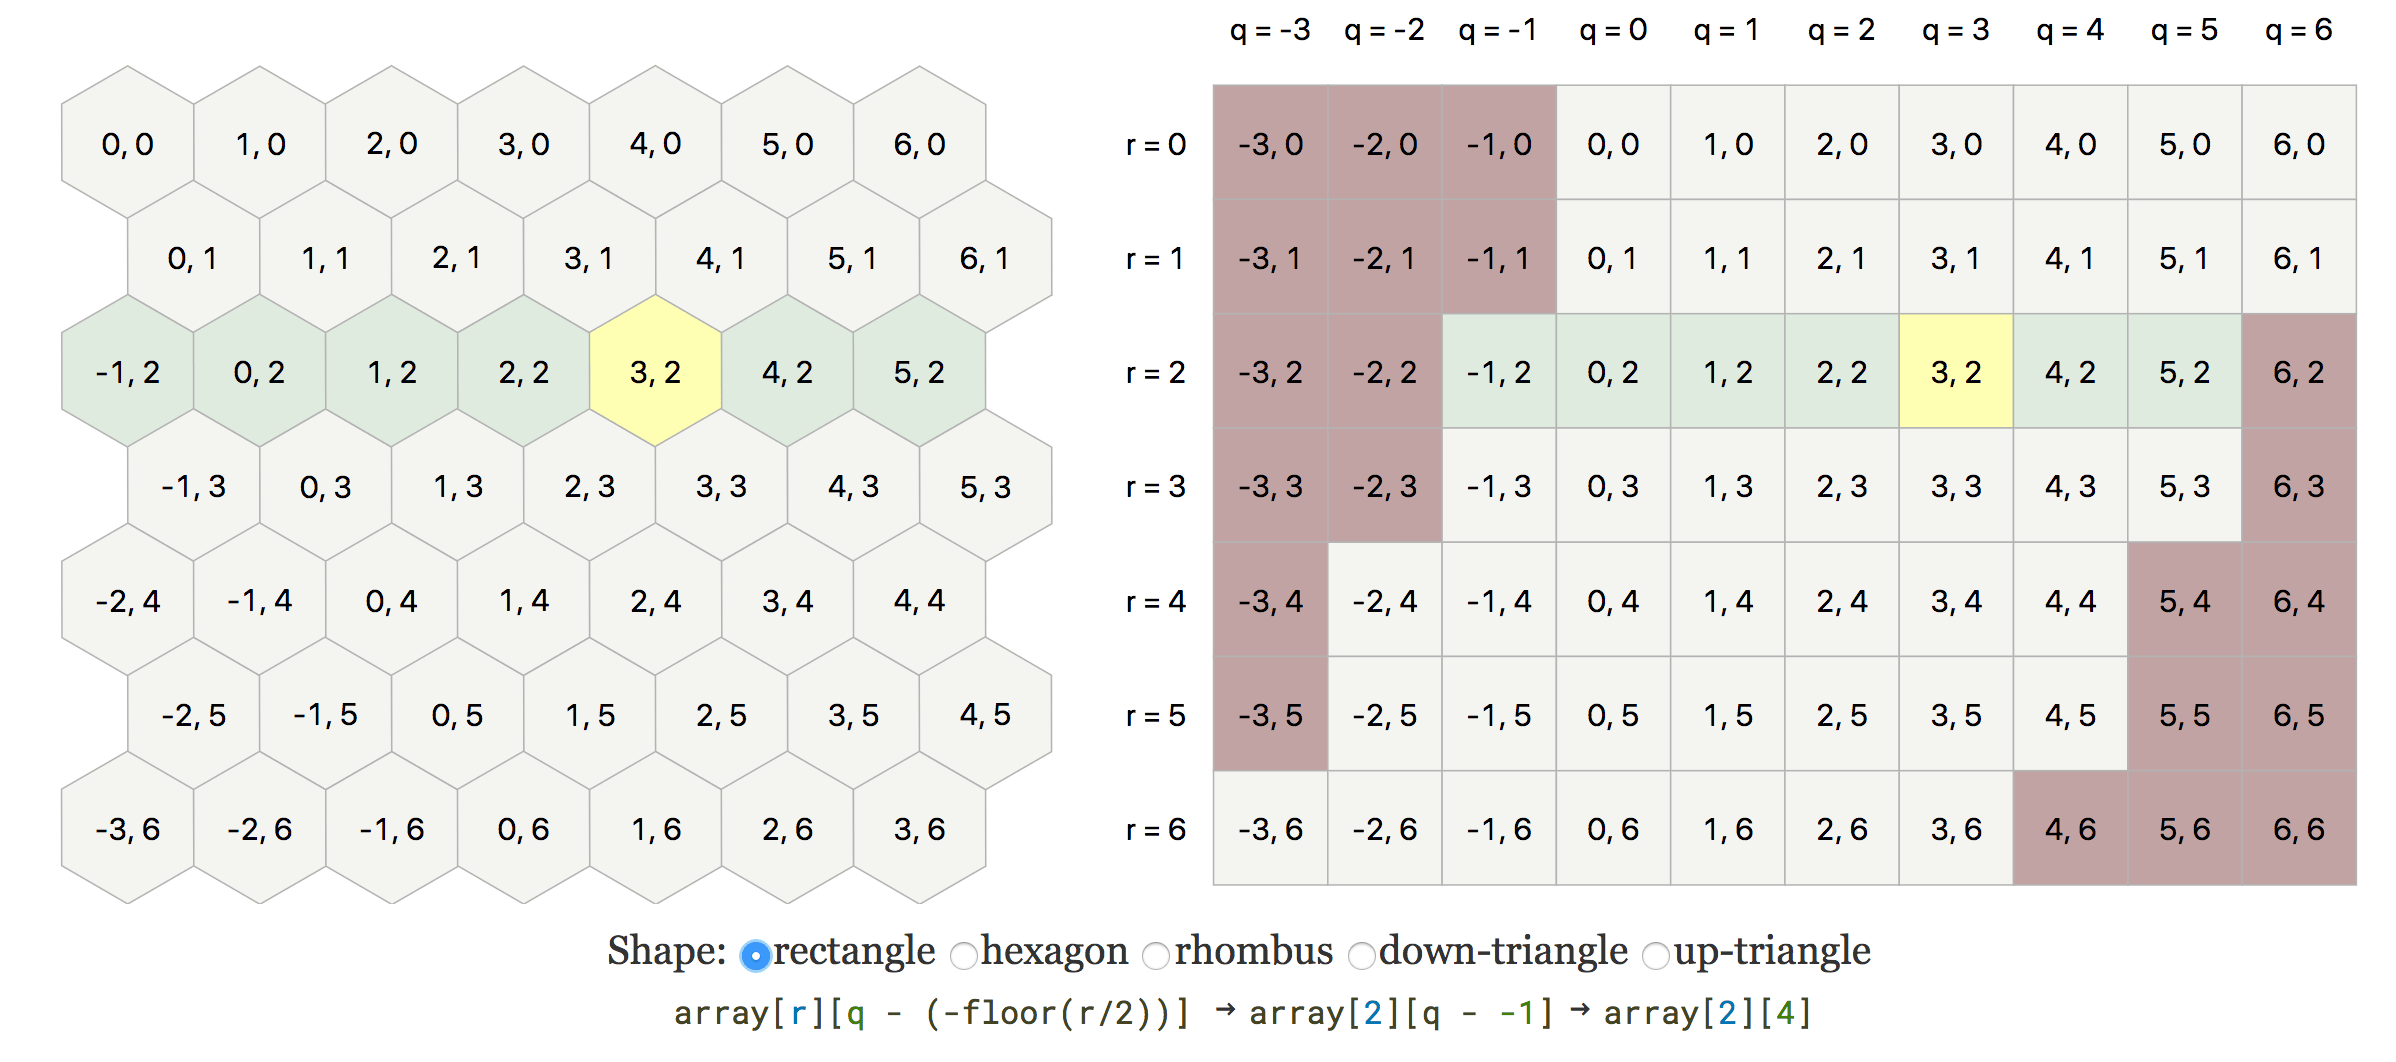
Last week, I decided to improve the map storage section of the hexagon guide. This section had a diagram that suggested the use of a 2D array, but then it presented formulas that didn't look like what was shown. Reader feedback made me realize this section was confusing. I was mixing two separate steps here.
- Store the map in a 2D array.
- Slide the rows to the left to save space.
Labels: hexagons
Improving island shaping for map generation #
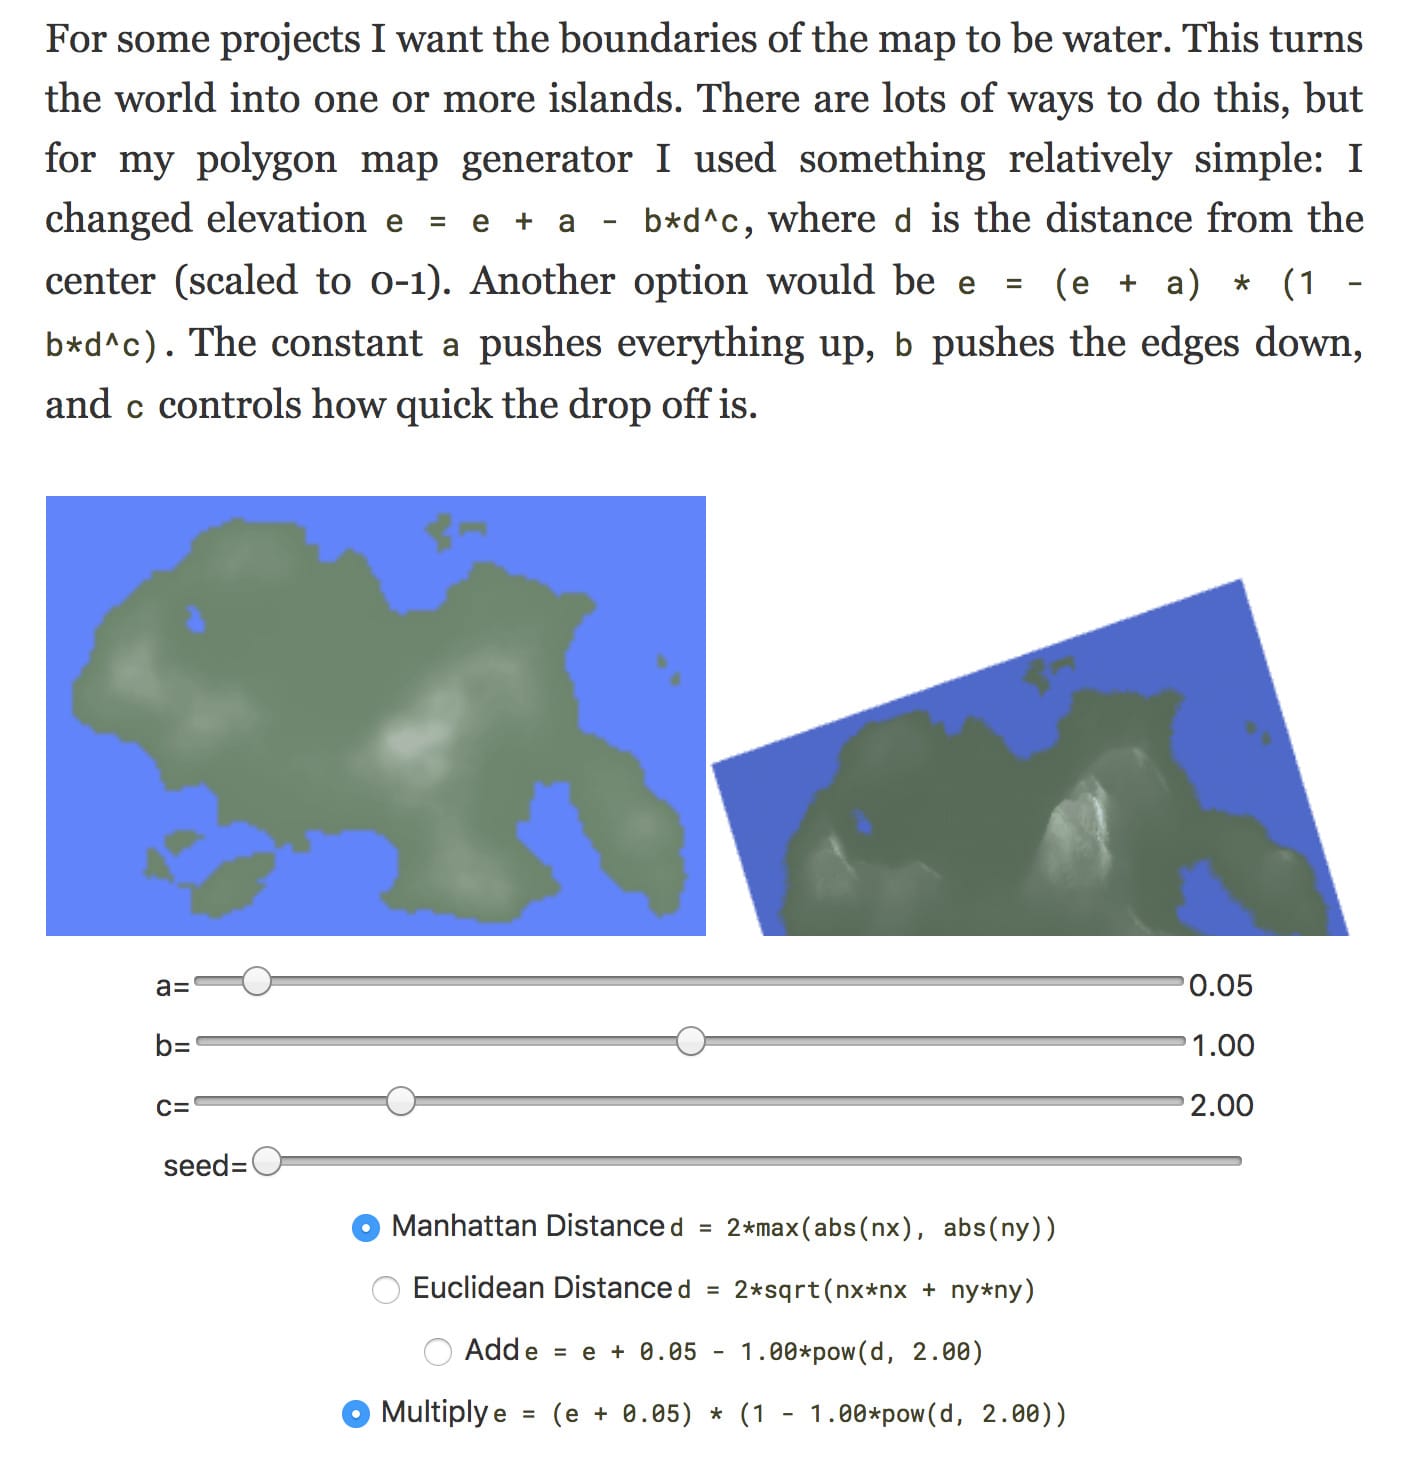
One of my goals for 2019 is to improve my existing pages. This week I improved the island map section of my noise-based map generation page.
Labels: maps
Improving the 2D Noise page #
One of my goals for 2019 is to improve my existing pages. Yesterday I decided to work on my old 2D noise page. We normally use Perlin/Simplex noise to make terrain heightmaps, but on that page I used Fourier transforms instead. Perlin/Simplex noise are a fast approximation of the things you can get from Fourier transforms.
The 3D renderer on that page always bothered me. It was one of my early experiments with WebGL. I had never been able to figure out exactly what I didn't like or how to fix it.
I decided to improve the renderer.
Hex grid guide load time, part 2 #
Last year I reimplemented my hexagon grid guide with the goals of making it easier for me to add content and also making it possible to load faster. I was able to speed up load time significantly by pre-rendering the SVG on the server. This is called "SSR with Rehydration" on Google's rendering tech page.
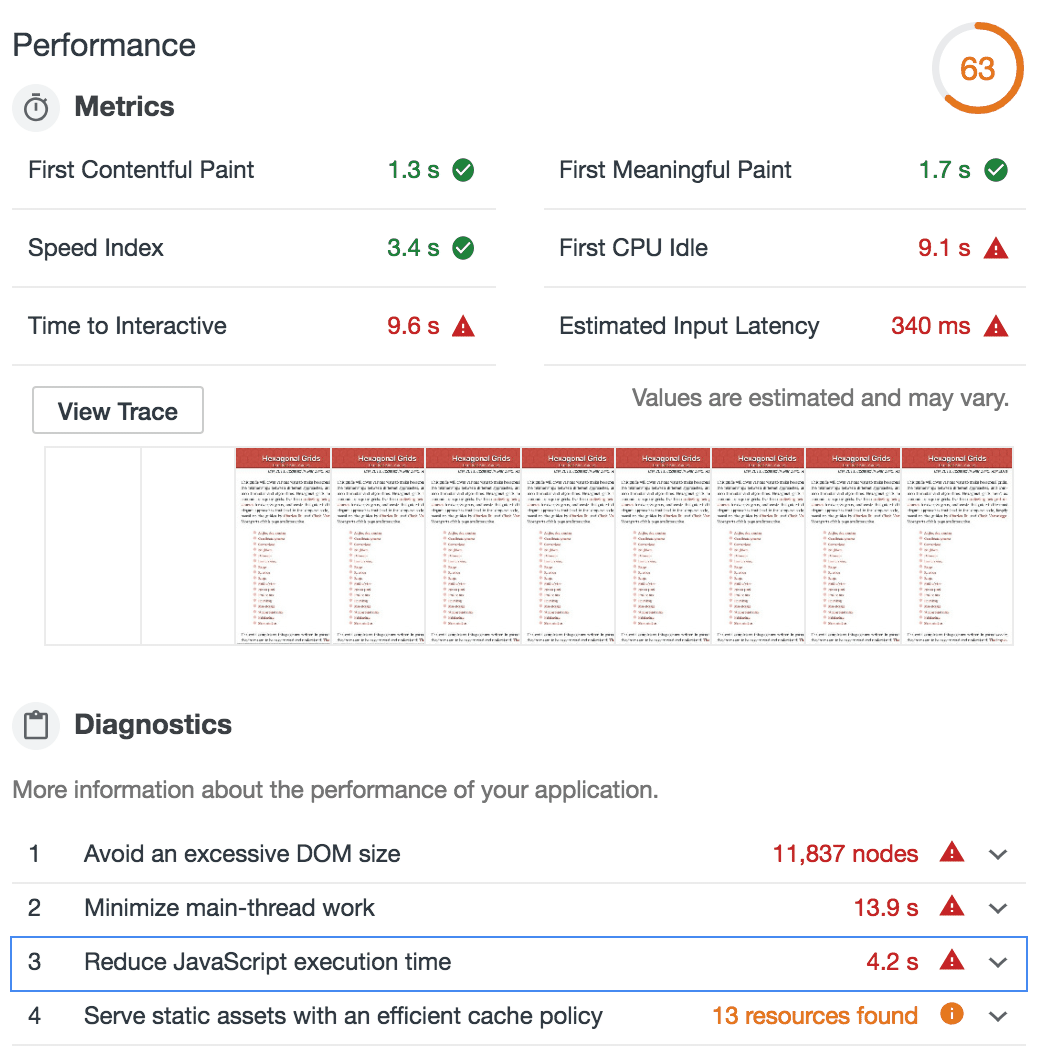
Last week I experimented with this a bit more. At load time, I was replacing the static SVGs with interactive SVGs. However, there's no need to do this immediately. I changed it to wait until the diagram was visible on screen (using IntersectionObserver). This helps quite a bit! The "time to interactive" score goes from 9.6sec to 4.9sec and the overall page speed score goes from 63 to 89:
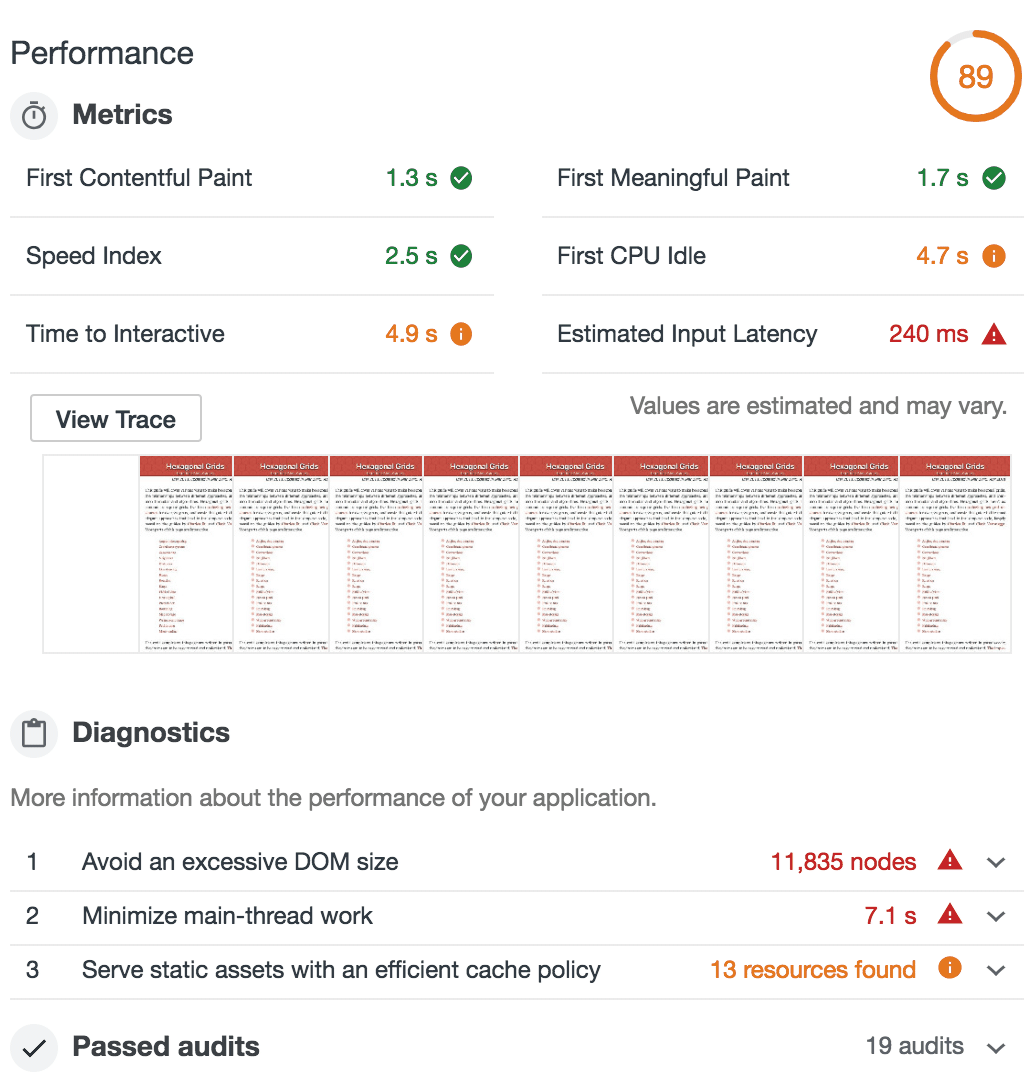
I was wondering if I could make it even faster by prerendering only some things on the server ("CSR with Prerendering" on Google's rendering tech page). The page shrinks from 633k to 179k! And the page score goes from 89 to 96. Time to interactive goes from 4.9s to 3.5s:
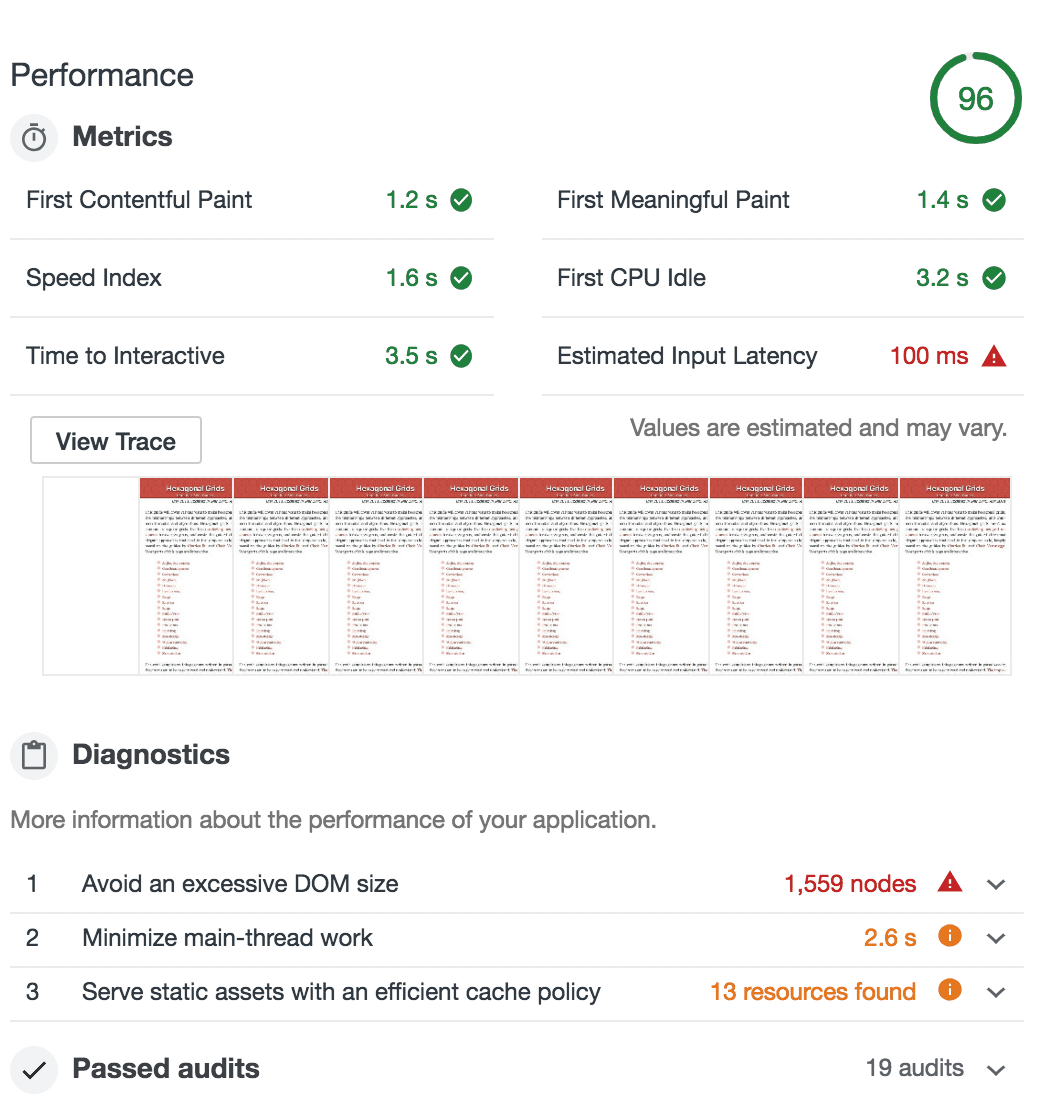
Great! However, it started to bring back the problems that I had solved last year. This version doesn't allow printing the page, loading it without Javascript, using "Reader modes" (including Pocket, Instapaper, RSS, etc.), or Ctrl+F to find diagram text on the page. The more I used the page, the more little glitches I found. None of these are super important, but they're not going to get better. In contrast, the load time will continue to get better as cpu and network speeds increase, HTTP/2 is adopted, and compression protocols improve (Brotli, HPACK, etc.). Another consideration is accessibility. I've been told that most screen readers support Javascript, but deferring the creation of SVG using IntersectionObserver means the SVG may never get created, so it would have the same problem as printing and Ctrl+F.
I decided to keep the pre-rendered static SVG for now, with deferred interactive SVG. It's simpler for me and I have fewer corner cases to deal with. I'll revisit this in the future when I update my A* pages to load faster.
Update [2022-11-01] Pre-rendering on the server was complicating my website management, so I took it out. The Lighthouse score continues to be good though.
Labels: making-of
Orbits of planets #
When I'm not feeling particularly inspired to work on a bigger project, I explore topics that might be useful later. I have been reading about planetary exploration, orbital mechanics, lunar chemistry, and other space topics. Along the way I found John Carlos Baez's blog post about the Pentagram of Venus. What a cool image! I wanted to try it myself. So I did.


Labels: math
Tiles and edges #
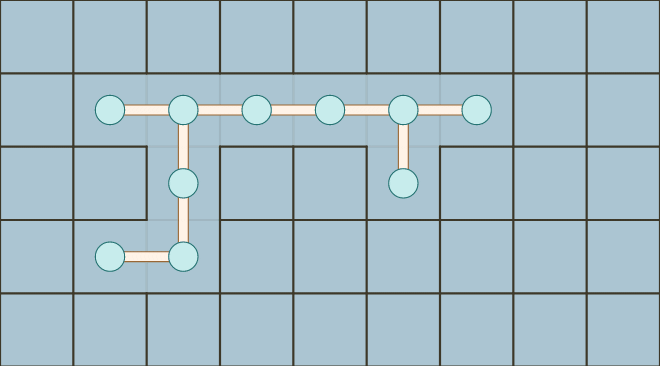
Last winter I was playing Factorio and Production Line, and explored the representation of conveyor belts on grids. This winter I've been playing Oxygen Not Included, and explored the representation of tiles and edges.
Labels: grids