Kingdoms of Amalur game maps #
Last month I described the reasons I don’t like the maps in Skyrim. Below are some maps from Kingdoms of Amalur: Reckoning, a game that’s been compared to Skyrim.
Here’s the world map in the game:

It shows where I am, the areas I’ve discovered so far, my current destination, areas of the world along with their names, and ways to travel between areas/zones. The map uses light shading and subtle texturing to keep the main areas clear and readable. Non-walkable areas are darker and strongly shaded to distinguish them from the main areas.
Here’s a local area map in the game:

It shows where I am, portals, merchants, healers, NPCs (white circles), dungeons, roads (main and side), shrines (green circles), and things I’ve spotted but not investigated yet (brown boxes). The investigation spots only show up if I’ve leveled up an exploration skill. In the northwest an area is dark because I haven’t explored it yet. Walkable areas are tan or gray, with subtle texturing. Non-walkable areas and unexplored areas are dark.
Here’s another area:

It shows larger and smaller roads, two bridges, a river, and monsters I’ve spotted. The monsters only get placed on my map if I have leveled up an exploration skill. Several areas fade to black because I haven’t explored them yet.
I love these maps! They are clean and easy to read. They show what’s important. They omit irelevant details (clouds, rocks, trees, plants). They’re updated as I explore and discover new things. They help me figure out where to go and how to get there.
How well do these maps answer the questions from my post about Skyrim’s maps?
| Player question | Amalur | Skyrim |
|---|---|---|
| Where have I been? | places, zones, roads | places only |
| What areas have I missed? | area map only | area map only |
| What have I done? | no | no |
| Where can I find resources? | some * | no |
| Where can I get some product/service? | yes | no |
| What do I want to return to? | no | no |
| Where have I been told to go? | one quest | all quests |
| What are the main areas? | zones only | zones, lakes, rivers, towns |
| What locations have I been told about? | (don’t know) | places only |
| How do I get to a specific place? | yes | no |
| How long would it take me to get somewhere | no | no |
| What dangers are along various paths? | in area map only * | no |
| Where are events occurring? | N/A | N/A |
| What has changed? | no | no |
| What did I miss? | N/A | N/A |
| * requires leveling up an exploration skill | ||
I only played the demo for a short time, so it’s possible I’ve missed some aspects of the maps in Kingdoms of Amalur. I’m finding the maps to be much more useful than the ones in Skyrim.
Tutorial: probability and damage rolls #
I’ve been interested in interactive diagrams for a while now, and started playing making illustrations with HTML5. I’ve written a tutorial on using randomness for damage rolls. Implementation notes:
- I’m using Mike Bostock’s D3.js + SVG for the diagrams.
- I’m using Bret Victor’s Tangle library for diagram parameters.
- You can drag the parameters around to change the diagrams. The idea is that you can edit the parameters in the sample code, and see the diagram update too.
- The draggable numbers from Tangle work on the iPad too.
- Most (all?) Android and Touchpad browsers don’t support SVG.
:-((Maybe I should’ve used Canvas) - Older versions of Internet Explorer don’t support SVG.
:-( - I designed the page to reformat itself for mobile browsers, narrow browsers, and wide browsers. I used CSS media queries for reformatting the text, but unfortunately had to use Javascript for redrawing the diagrams.
- Red Blob Games is where I’ll be placing my new tutorials and articles, instead of my Stanford alumni account.
At some point I’d like to go back to my existing articles and update them with interactive diagrams. I’m just not yet sure where they might be useful instead of gimmicky. I’d also like to write a tutorial about random loot drops.
Labels: math , programming
Skyrim and game maps #
I've been playing Skyrim lately. A lot of Skyrim: over 70 hours in 3 weeks. Naturally, I had some thoughts on the maps in the game.
Read the article on my main site.
Side note: I'm not really happy with my blog format. It's designed around updates, but many of my writings are more “reference” style articles that I'll update over time. With the polygon map posts, I experimented with formatting the content twice, once for the blog and once for the site. That led to fragmented discussions, and it was also a lot of extra work for me. For some posts I experimented by having a reference-style post only on the blog, but these didn't fit well into the main site. For this post I'm experimenting with the opposite — I'm keeping the content on the main site, but using the blog only as a pointer to it.
Crafting graphs #
I’ve only played a few games with crafting, but the basic approach seems to be that I collect some materials and then combine them into what I want to make. In some games the recipes are in the game; in others I have to find them on a wiki. Many games have multi-step crafting, where I can use a crafted item as a material to craft another item.
In a game where I find crafting materials randomly (e.g. Dungeons of Dredmore), the question I want to answer is which of these items do I want to make with what I have, or do I want to wait?. For example, if I find a Gel in Terraria, this is what I can make, sometimes by combining Gel with something else:

In a game where I can choose to find materials (e.g. Terraria) or buy materials (e.g. World of Warcraft), the question I want to answer is what materials do I need to make what I want? For example, if I want a Hero’s Hat in Terraria, this is what I need:

Both of these are subsets of a crafting graph, which may be rather complex and difficult to show on the screen at once. This is an approximate graph for Minecraft crafting:
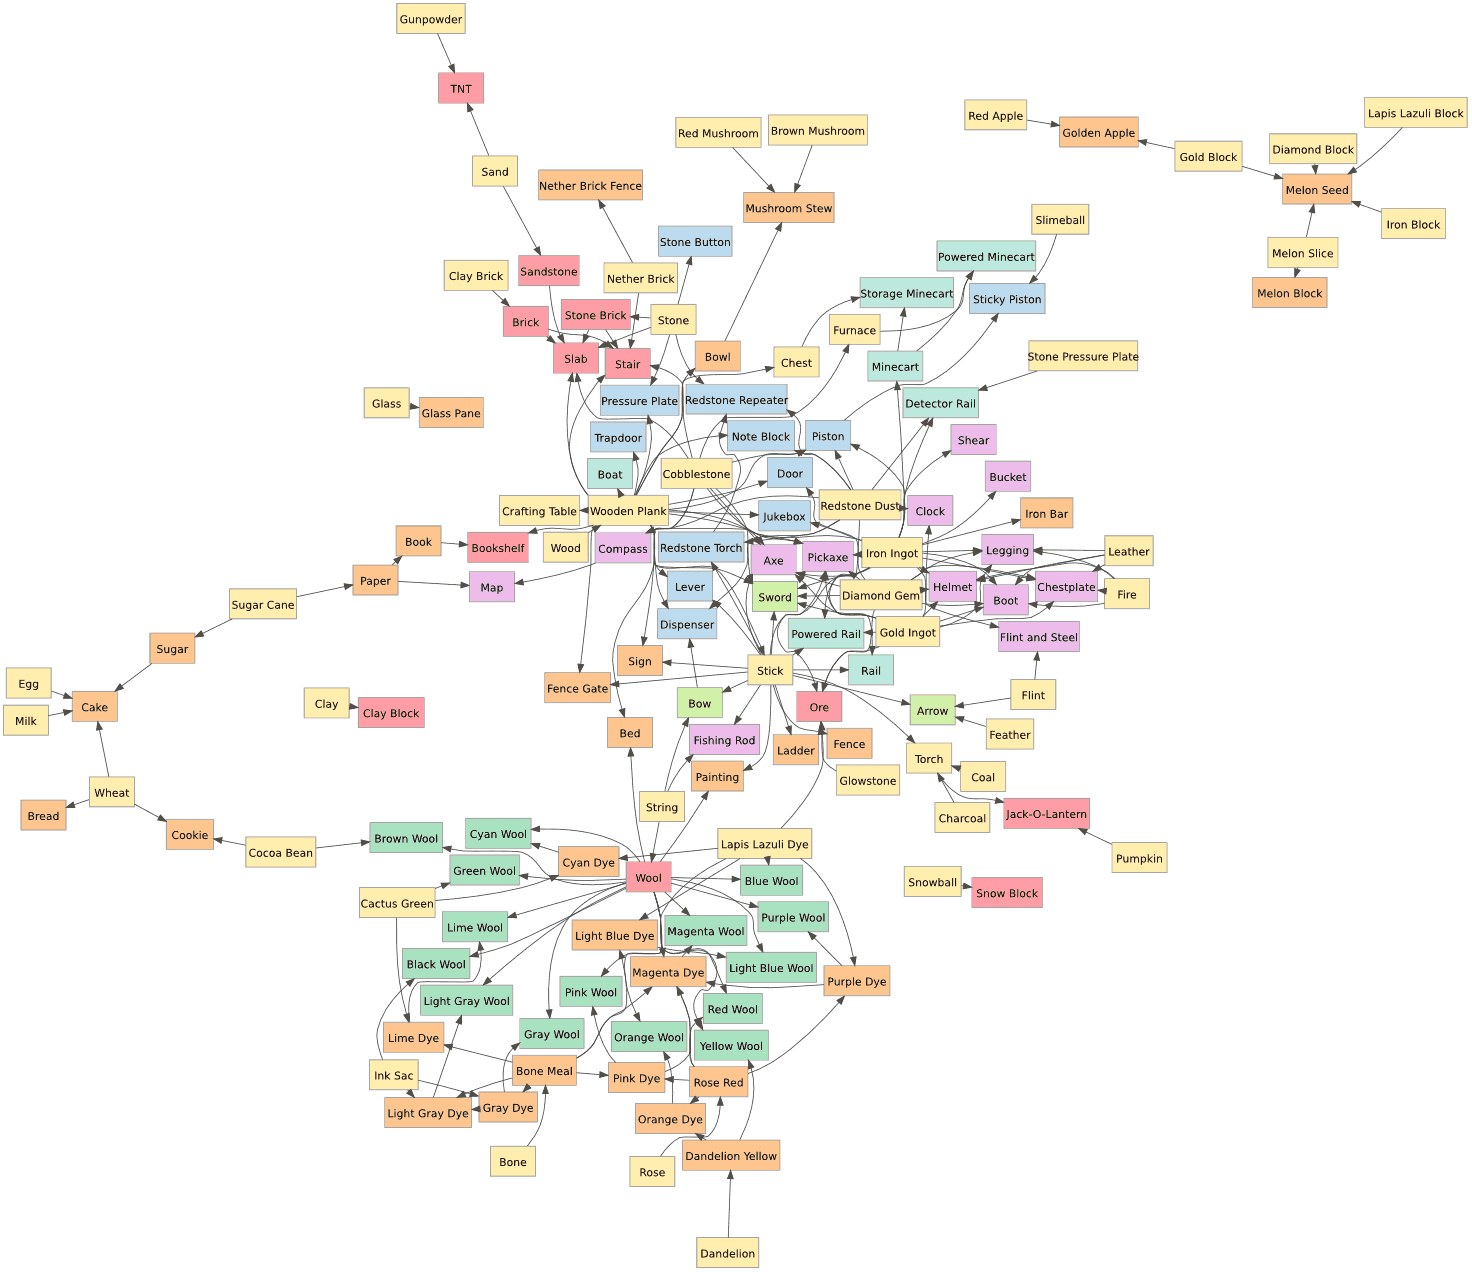
I either want to look forwards from the materials I currently have or I want to look backwards from the items I want to make. Games typically give me a UI that only shows a single step forwards. They can’t show the entire crafting graph because it’s typically too complex.
I’d like better ways to interact with the crafting graph:
- In games with a complex crafting graph, help me explore it in the game so I don’t need to use a wiki to find the information.
- In games where I’m discovering crafting recipes, help me track what I’ve learned and what I’m missing.
- In games where I’m able to pick which materials to find, help me track goals like “make Hero’s Hat” that translate into subgoals like “find 9 seeds from the Jungle”.
- In games where I’m unable to pick which materials to find, consider adjusting the loot drop rates to favor materials that would be useful for the goals I’ve set.
In the good old days, RPGs didn’t explicitly track the map or quests for you. Instead, you did it yourself, on paper. These days, RPGs have removed much of the mundane aspects of tracking things by automatically remembering things for you. There are nifty interfaces for maps, skill/tech trees, quests, subquests, lore, and so on. I’d like to see that sort of thinking applied to crafting.
Labels: ideas
Polygon map generation, part 3 #
In the previous blog posts (part 1 and part 2), I described generating random polygonal maps with elevation, moisture, biomes, and rivers. For some games, those maps are sufficient. However, in other games I want to hide the polygon structure. In this blog post I'll describe how to render the polygons into a game map that doesn't look polygonal, and conclude with the demo and source code.
The full article is here. There's also a demo and source code.
Noisy Edges
Recall from earlier that there are two graphs: one for Voronoi
corners (1, 2 in the diagram below) and edges (blue lines), and
one for polycon centers (A, B) and Delaunay edges (red
lines) between them:

I wanted to add some “noise” to the the straight lines. I tried making them move randomly, but sometimes lines would cross, and I realized I needed to constrain them so that they would never cross each other. The second thing I wanted was to make sure that the lines had as much space to wander as possible.
I realized that points A, 1, B, and 2 form a quadrilateral, and
I could constrain the wanderings of the line segment to that quadrilateral:

I further divided the quadrilateral into four quadrilaterals. Two were usable for the red (Delaunay) edge and two for the blue (Voronoi) edge. As long as the lines stayed within their allocated space and met in the center, they'd never cross each other. That takes care of constraining them.
The entire map can be divided up into these quadrilateral regions, with no space left over:

That ensures that the noisy lines aren't constrained any more than necessary. (I wonder if these quadrilaterals would be useful for game mechanics.)
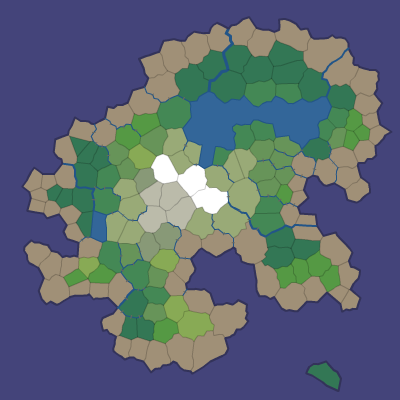
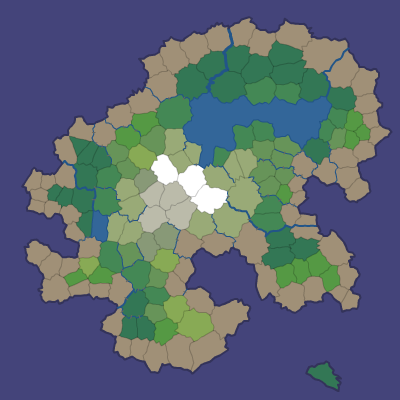
I can use any noisy line algorithm that fits within these constraints. I decided to subdivide the quadrilaterals recursively and stitch line segments together within the small quadrilaterals into a complete edge. The result is here:

The noisiness is tunable, and I have examples at segment size 7, segment size 4, and segment size 1. In the map demo I use segment size 1 for rivers and coastlines, 3 where biomes meet, and 10 elsewhere.

More noise
I'm generally a fan of noise in game art, and wanted to add a little bit of noise to these maps as well. In a real game map the noise might reflect vegetation or small variations in terrain. In the demo I just filled the screen with a random noise texture, and smoothed the colors between adjacent polygons:

However, with a bit more random noise, we can generate this (described in the full article):

Here's a rendering with 16,000 polygons, noisy edges, a noise texture overlay, and simple lighting:

Demo
I wrote a Flash demo to explore the generated maps:

The simplest way to explore the maps is to click Random and the various View options.
In a shape number like 85882-3, 85882 chooses the overall island
shape and 3 is the random number seed for the details (random points,
noisy edges, rivers, lava). You can type in a shape number and press
Return to generate that map. The demo also shows some unfinished
features that may be useful for some games: lava, roads, and
watersheds.
Source
I've placed the Actionscript source under the MIT license; it's available on github. There's an overview page describing what's in these blog posts, along with notes about the code. I don't expect that the code will be immediately useful to anyone, but it might be a useful starting point if you'd like to use these techniques for making your own game maps. The diagrams are built with 300 polygons, the demo uses 2000, and the code can go much higher, although I've not tried above 16,000.
If you find the ideas or code useful, I'd love to hear about it!
Update: [2010-09-22] I added a noisier rendering, which is described in the full article.
Polygon map generation, part 2 #
In the previous blog post I described creating polygon island maps. Given random points, Voronoi diagrams with Lloyd relaxation produce a nice set of polygons. The polygons, their edges, and their corners can be represented as two related graphs. Given a random shape, those polygons can be marked as land, ocean, or lake. In this blog post I'll describe how to add elevation, rivers, moisture, and biomes to make the maps interesting.
The full article is here. There's also a demo and source code.
Elevation
The most realistic approach would have been to define elevation first, and then define the coastline to be where the elevation reaches sea level. Instead, I'm starting with the goal, which is a good coastline, and working backwards from there. I set elevation to be the distance from the coast. I originally tried elevations at polygon centers but setting elevations at corners worked out better. Corner-to-corner edges can serve as ridges and valleys. After calculating the elevation of corners, the polygon elevation is the average of the elevation at the corners.
Water polygons don't count towards the distance. This is both because I expect lakes to be flat instead of sloped, and because this tends to build valleys around lakes, which helps guide rivers towards lakes.

One problem with the simple definition is that some islands have too many mountains and others have too few. To fix this, I redistribute the elevations to match a desired distribution, which has more low elevation land (coastline) than high elevation land (mountains).
Elevations always increase from the coast to the mountains. That means that for any location, going downhill will eventually lead to the ocean. This diagram shows the steepest downhill direction from every corner:

By following the downhill arrows from any location, we eventually reach the ocean. This will be useful for rivers but may also be useful for calculating watersheds and other features.
I had two main goals for elevation:
- Biome types: high elevations get snow, rock, tundra; medium elevations get shrubs, deserts, forests, and grassland; low elevations get rain forests, grassland, and beaches.
- Rivers flow from high elevations down to the coast. Having elevations that always increase away from the coast means that there's no local minima that complicate river generation.
In addition, games may define their own use of elevation data. For example, Realm of the Mad God uses elevation to distribute monsters.
Rivers
Rivers and lakes are the two fresh water features I wanted. The most realistic approach would be to define moisture with wind, clouds, humidity, and rainfall, and then define the rivers and lakes based on where it rains. Instead, I'm starting with the goal, which is good rivers, and working backwards from there.
The island shape determines which areas are water and which are land. Lakes are water polygons that aren't oceans.
Rivers use the downhill directions shown earlier. I choose random corner locations in the mountains, and then follow a path down to the ocean. The rivers flow from corner to corner:

I tried both polygon centers and corners, but found that the corner graph made for much nicer looking rivers. Also, by keeping lakes flat, elevation tends to be lower near lakes, so rivers naturally flow into and out of lakes. Multiple rivers can share the lower portion of their path, but once they join, they never diverge, so tributary formation comes for free. It's simple and seems to work pretty well.
Moisture
Since I'm working backwards, I don't need moisture to form rivers. However, moisture would be useful for defining biomes (deserts, swamps, forests, etc.). Since rivers and lakes should form in areas with high moisture, I defined moisture based on distance from fresh water:

As with elevation, I redistribute moisture to match a desired distribution. In this case, I want roughly equal numbers of dry and wet regions. In this map generator, moisture is only used for biomes. However, games may find other uses for the moisture data. For example, Realm of the Mad God uses moisture and elevation to distribute vegetation.
Biomes
Together, elevation and moisture provide a good amount of variety to define biome types. I use elevation as a proxy for temperature. Biomes first depend on whether it's water or land:
- Ocean is any water polygon connected to the map border
-
Lake is any water polygon not connected to the map border
- Ice lake if the lake is at high elevation (low temperature)
- Marsh if it's at low elevation
- Beach is any land polygon next to an ocean
For all land polygons, I started with the Whittaker diagram and adapted it to my needs:
| Elevation | Moisture | |||||
|---|---|---|---|---|---|---|
| Wet | Dry | |||||
| High | Snow | Tundra | Bare rock | Scorched | ||
| Medium-high | Taiga | Shrubland | Temperate desert | |||
| Medium-low | Temperate rain forest | Temperate deciduous forest | Grassland | Temperate desert | ||
| Low | Tropical rain forest | Tropical seasonal forest | Grassland | Subtropical desert | ||
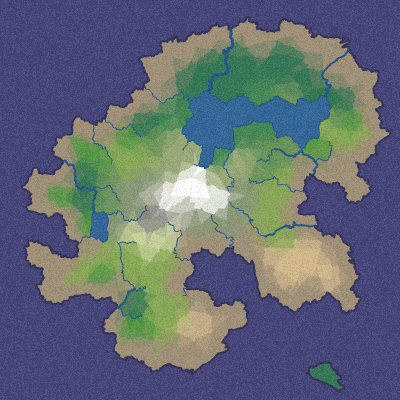
Here's the result:

These biomes look good in the map generation demo, but each game will have its own needs. Realm of the Mad God for example ignores these biomes and uses its own (based on elevation and moisture).
In the last blog post I'll describe how I get from this biome map to maps like this: (or even this!)
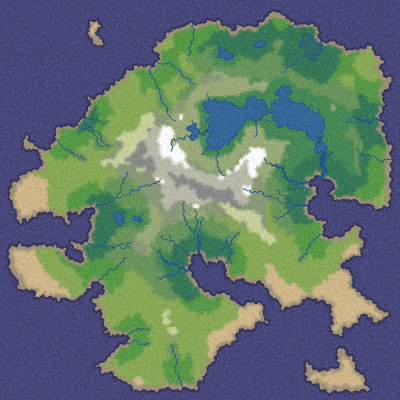
Update: [2010-09-22] I replaced the last diagram on this page with what I originally wanted but didn't finish in time for the blog post. At the time of posting, I used this image instead.
Polygon map generation, part 1 #
I wanted to generate interesting game maps that weren't constrained to be realistic, and I wanted to try some techniques I hadn't tried before. I usually make tile maps but this time I decided to make polygonal maps. Instead of 1,000,000 tiles, what could I do with 1,000 polygons? I think the distinct player-recognizable areas might be useful for gameplay: locations of towns, places to quest, territory to conquer or settle, pathfinding waypoints, difficulty zones, etc.
There were three main things I wanted: good coastlines, mountains and rivers. For the coastline, I wanted to make island/continent maps that are surrounded by ocean, so that I don't have to deal with people walking to the edge of the map. For the mountains, I started with something simple: mountains are whatever's farthest from the coastline. For the rivers, I started with something simple: draw rivers from the coast to the mountains.
The full article is here. There's also a demo and source code.
Polygons
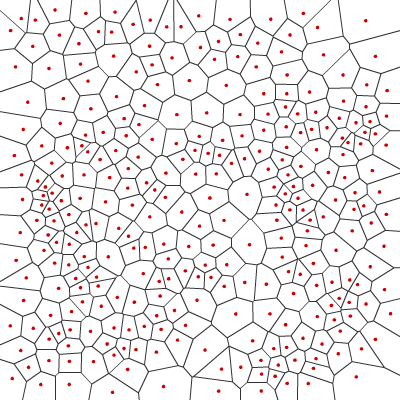
The first step is to generate some polygons. I picked random points and generated Voronoi polygons, which are used for lots of things, including maps. Here's an example of random dots (red) and the polygons that result:

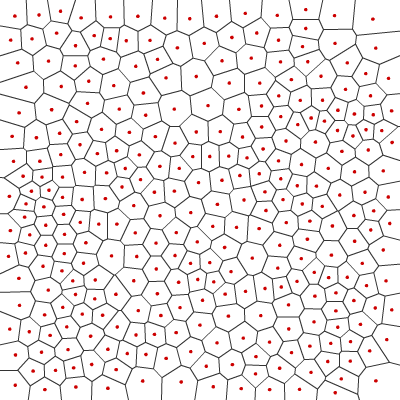
The first problem is that polygon shapes and sizes are a bit irregular. Random numbers are more “clumpy” than what people expect. What I really want is semi-random “blue noise”, not random points. I approximate that by using Lloyd relaxation, which is a fairly simple tweak to the random point locations to make them more evenly distributed. Here's the result after running Lloyd relaxation twice:

Compare it to running once or fifty times. The more iterations, the more regular the polygons get. Running it twice gives me good results but every game will vary in its needs.
[2010-09-22] The second problem with the polygons is that some edges are very short. For games where boundaries between polygons matters, having short edges is a problem. We can adjust the edge lengths by moving corners, but we lose the Voronoi properties. Since I'm using Voronoi only to generate polygons, and do not need to preserve the Voronoi properties, I move the corners to the average of the polygon centers they touch. Note: I added this code after the initial blog post, and did not update diagrams to show this step.
Map Representation
I'm representing the map as two related graphs: nodes and edges. The first graph has nodes for each polygon and edges between adjacent polygons. It represents the Delaunay triangulation, which is useful for anything involving adjacency (such as pathfinding). The second graph has nodes for each polygon corner and edges between corners. It contains the shapes of the Voronoi polygons. It's useful for anything involving the shapes (such as rendering borders).
The two graphs are related. Every triangle in the Delaunay triangulation corresponds to a polygon corner in the Voronoi diagram. Every polygon in the Voronoi diagram corresponds to a corner of a Delaunay triangle. Every edge in the Delaunay graph corresponds to an edge in the Voronoi graph. You can see this in the following diagram:
Polygon A and B are adjacent to each other, so there is a (red) edge
between A and B in the adjacency graph. For them to be adjacent there
must be a polygon edge between them. The (blue) polygon edge connects
corners 1 and 2 in the Voronoi shape graph. Every edge in the
adjacency graph corresponds to exactly one edge in the shape graph.
In the Delaunay triangulation, triangle A-B-C connects the three
polygons, and can be represented by corner 2. Thus, corners in the
Delaunay triangulation are polygons in the Voronoi diagram, and vice
versa. Here's a larger example showing the relationship, with Voronoi
polygon centers in red and corners in blue, and the Voronoi edges in
white and the Delaunay triangulation in black:

This duality means that I can represent the two graphs together. Edges are the key. Each edge in a normal graph points to two nodes. Instead of representing two edges in the two graph separately, I made edges point to four nodes: two polygon centers and two corners. It turns out to be quite useful to connect the two graphs together.
With the combined representation, I can now use the Relationships Between Grid Parts sections of my article on grids. They're not grids so I'm not assigning grid coordinates, but many of the algorithms that work on grids also work here, and the algorithms that work on graphs also work here (on either of the two graphs).
Islands
The second step is to draw the coastline. I used a simple function to divide the world into land and water. There are many different ways to do this. You can even draw your own shapes, e.g., a skull island. The map generator works with any division of points, but it forces the outer layer of polygons to be ocean. Here's an example that divides the world into land and water:

A simple flood fill starting from the border of the map can determine which water areas are oceans (connected to the border) and lakes (surrounded by land):

In the next two blog posts (part 2, part 3) I'll describe how I add elevation data to build mountains and valleys, add moisture data for lakes and rivers, render the map so that it doesn't look polygonal, and conclude with the demo and source code. Together, elevation and moisture produce a good range of terrain and map features. The goal is to produce maps like this:
Update: [2010-09-22] Since the original blog post, I added a corner adjustment step to lengthen short edges. Just as Lloyd relaxation improves the polygon sizes, I needed to adjust the edge lengths. The adjustment does not preserve Voronoi properties, but I'm not using those properties so it worked out. I didn't update diagrams to reflect this change. I also improved map rendering and replaced the last diagram on this page. I originally wanted to have a rendering that didn't show the polygons at all, but couldn't get it to work in time, so at the time of the blog post I used this rendering instead. The rendering technique is described in the full article but not in the blog posts.
Map rendering: cutting corners #
I was drawing tile maps in Flash and found a cheap trick that improved the appearance of the maps, so I thought I'd share. Here's how I had been drawing the tile map:

In a bitmap-based graphics engine, you can smooth the edges of the tiles either by adding transition tiles (see this article or this article or this article) or by using a blending mask between adjacent tiles.
Flash, OpenGL, and DirectX are vector-based engines. The bitmap techniques still work, but there are new possibilities available. I'm drawing each square tile by filling a square polygon with a bitmap texture. The engine doesn't care that it's square; it works on any polygon. I'm taking advantage of this with what I call “vertex displacement”:

I look at the four tiles touching each vertex. If three of them are the same and the fourth is different, I move the vertex to expand the area of the three common tiles and shrink the area of the uncommon one. It's easier to see the effect with the polygon borders:

It turns out there are other fun things you can do with this trick. For example, a little bit of random noise on each vertex makes for a map that looks a little more hand drawn:

I've also used it to animate the boundary between the ocean and the beach. I added vertex displacement to my simple map generator; see the demo (Flash). Try changing the corner setting to adjust how much the corners get moved when three tiles are the same, and the random setting to adjust how much vertices get randomly moved. I have a separate demo (also Flash) to show the animated coastline.
The technique has its limitations. Terrain boundaries that don't fall on a 45° angle look wavy (see example). Some terrain types shouldn't meet in this way. And the biggest limitation is that it only applies when the terrain texture has no major features (such as trees, rocks, etc.). But it's a cheap enough trick that it's worth keeping in my toolbox.

Update: [2012-03-30] Also see Marching squares.
Labels: maps
Teleological vs. ontogenetic map generation #
Edit: The feedback from comments is that the names “teleological” and “ontogenetic” aren't good fits. I agree. There's an interpretation in which the terms work but there are also other ways to interpret them where it doesn't make sense. I had gotten the terms from the procedural content wiki, but in the future I'll avoid using these terms. I've changed the blog text to use “bottom up” and “top down”. Thanks for the feedback.
Long ago, I spent years working on the terrain generation for a game I worked on. I used earthquake faults, volcanoes, soil erosion, lava, river erosion, sediment deposition, water flow, weather simulation, vegetation (affected soil, which affected erosion), forest fires, floods, continental uplift, and other physical processes. This is the teleological approach bottom up approach to making maps.
To make good maps, I'd change parameters and run it to see if the maps looked good. I'd go back and change parameters again and again. Ideally I'd write a search/evolutionary algorithm that explored the parameter space. To do that I need to write code to determine whether a map will look to my eye, and I never did figure that out. I knew it when I saw it.
The other approach to map making is ontogenetic top down. Start with the structure you want to see, and make algorithms produce that directly and fill in the details. This is what I did with last year's simple map generation project. I had seen Perlin Noise, and thought, hm, that looks vaguely like a map — let's see how much work it takes to turn it into a map. Not much, it turns out!
For the past month I've been working on a new map generation project. I wanted island/continent maps with rivers, and Perlin Noise wasn't a good fit for that. I tried making random mountains come out of the ocean, and then using water flow algorithms to carve out rivers. I've been tweaking and testing, tweaking and testing, tweaking and testing, and finally realized that I'm back to using bottom up algorithms. It's incredibly addictive. It feels right: erosion, mountains, gravity, and all the other “realistic” things that form terrain.


The trouble is that I really don't need all of that. I'm working on 2D Flash games, and I don't need terrain; I need maps. It doesn't need to be completely realistic. It just has to be interesting. So I'm stepping back a bit and switching back to the top-down approach. I'm drawing some maps that I like, and then I'll find algorithms that generate maps like those, instead of modeling physical processes that produce realistic terrain. I think this will lead to better maps with less work.
Update: [2010-09-04] See my newer blog post to see the beginning of the new map generation project.
Varying game difficulty #
Contrast is commonly used for visuals and sometimes for music but you can also use it for game difficulty. The usual pattern in nature is slow rises and sharp falls.
- The stock market tends to slowly go up and occasionally drop dramatically.
- When you build a sand castle on the beach, you slowly make it larger, and then suddenly a wave destroys it all.
- Forests grow slowly, and once in a while a fire will wipe out large sections of forest.
- Stress slowly builds up in rock faults, and then an earthquake will suddenly release a large amount of stress.
In games we see this same pattern. Think of how many games you've seen that start off slow, build up, and then have a “boss” fight, followed by the relative calm of the next area. The difficulty or excitement might look a lot like a stock market plot.
One major difference between games and the patterns in nature is that you can't always predict the falls in nature. I've seen some games where a boss is unexpectedly followed by another boss, but usually you roughly know what's going to happen after a boss fight. In games where encounters are dynamically generated, it might be interesting for the encounters to follow a pattern like those seen in nature. More randomness with slow increases and sudden drops could make games more exciting.