Dijkstra's Algorithm and reprioritizing nodes #
I'm working on a tutorial showing how Breadth First Search, Dijkstra's Algorithm, Greedy Best-First Search, and A* are related. I'm focusing on keeping the code simple and easy to understand. {Note: this blog post is a shorter version of a page on my site}.
While tracking down a bug in my Dijkstra's Algorithm code, I realized I had forgotten to implement the "reprioritize" case. That led me to wonder why my code seemed to work without handling that case. It turns out that case is never triggered by the graphs I'm searching over. Let me explore this …
Labels: pathfinding , programming
Prospect theory and utility functions #
(Note: I'm going to try writing more unpolished things on this blog and leave the polished articles to redblobgames.com.)
The utility functions I learned in economics are history-agnostic. They look at the current state of the world and calculate a “utility”. For example, you might say the utility of money is the logarithm of the amount of money you have.
Prospect Theory says that this view of the world does not match how people actually behave. Instead, the history of how you got to a certain point matters in how you value it. There's an asymmetry around a “reference point”:

(credit: Wikipedia, Prospect Theory page)
Consider these scenarios:
- You get $200 and have a 90% chance of losing $100 of it.
- You get $100 and have a 10% chance of gaining an additional $100.
These are mathematically equivalent. Both have a 90% chance of giving $100 and 10% chance of giving $200. However, they are not equivalent to humans. That's because humans consider not only the final result but how it was reached. Having $200 and then losing $100 feels different from having just the $100 in the first place. Even though the outcomes are the same, the reference point is different, so it feels different. Prospect theory takes this into account somewhat.
In game AI, I've only used regular utility functions. However, it seems reasonable to try using prospect theory in some way. Even prospect theory isn't complete; there are more human behaviors in decision making and valuation that it doesn't account for. Maybe FTT or something else. But sometimes you want to balance simplicity and comprehensiveness. In any case, it's something I'll want to ponder the next time I'm writing AI evaluation functions for NPCs.
Map homunculus #
Suppose I’m telling a story about someone walking through the woods to get to grandma’s house. Let’s look at how much time is spent in each activity:
I don’t write the same number of sentences in the story on each minute of the adventure. The sentences might be distributed like this:
Let’s look at how interesting each part of the story is over time:
If the storyteller were forced to match the pacing of the story with the amount of time each actually took, we’d have long periods of boring story.
Instead, the storyteller can stretch out interesting times and compress boring times to more evenly distribute interesting events:
Let’s look at where the events occur on this distorted timeline:
They’re much more evenly distributed.
Think about every story you have read and every movie you have watched. Most of them will stretch and shrink time by omitting or elaborating various details. They also use flashbacks and replays to further disconnect the time you experience from the time in the story.
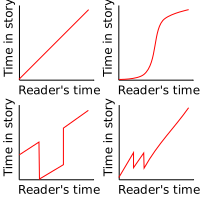
We want to do this in many types of games.
In a game that directly tells a story, you can follow the technique used by storytellers. But what about more open ended games?
If you can’t stretch and shrink time, try to stretch and shrink space.
Let’s look at some games that stretch and shrink game maps.
Ultima IV-VII
Ultima 4 and 5 have a continental map that’s almost all wilderness. In Ultima 6, the towns were integrated into the world map. Surrounding areas were shrunk to make room for the towns. In Ultima 7, the towns grew even larger and boring parts of the wilderness shrunk even more. Here’s a rough sense of how that looked:
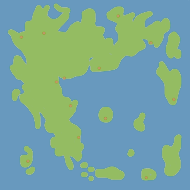
Ultima 4
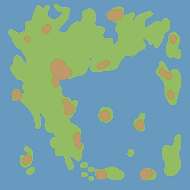
Ultima 6
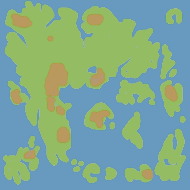
Ultima 7
If you want to see the actual maps, there’s a high resolution map of Ultima 4 from Nick Moore, and there are high resolution maps of Ultima 6 and Ultima 7 from Ian Albert. You can find some scans of the cloth maps that came with these games on Xe Dragon’s site.
Let’s look at the path from Trinsic to Britain. In Ultima 4, most of that time is in the wilderness, which I found relatively uninteresting in that game:
Ultima 4 and 5 solved this problem by having a separate map for towns. When you entered the town on the main map, you were taken to a more detailed map with the town. Ultima 6 and Ultima 7 solve the problem a different way, by changing the world map:
By stretching and shrinking the map, the Ultima series made the walk from Trinsic to Britain more interesting, but less realistic.
Skyrim and World of Warcraft
Ultima not only shrinks the repetitive areas between cities but also repetitive areas within cities. Most buildings have something interesting inside; other buildings are omitted.
The same is true in many other open-world games. Skyrim’s towns have very few people. Wowwiki says World of Warcraft’s Stormwind City has 200,000 residents. Walk around and you’ll see fewer than 100 buildings and people. Both games also shrink wilderness areas relative to cities. Stormwind City is as large as Elwynn Forest. Towns are much smaller than realistic towns would be; wilderness areas are extremely small compared to realistic counterparts.
Civilization and Age of Empires
We see this same pattern in conquest games, but it manifests differently. You’re not an adventurer walking across a map but you instead control military units walking around. Repetitive elements include wilderness, natural resources such as trees, military units, and town buildings. Each of these is reduced in size or number. A large army may consist of tens of “soldiers”.
Civilization also has a slowing of time. At the beginning of the game, a turn might mean 50 years. At the end of the game, a turn is only 1 year.
Transport Tycoon
In a transportation game the repetitive elements will be vehicles. A freight train in real life might have hundreds of cars but in Transport Tycoon will have fewer than ten. This makes cars easier to manage. A freight track might be 100 trains long; in Transport Tycoon distances between resources are shrunk so the track to train length ratio is much smaller than in real life. This also alters the balance for gameplay. Relative to real life, trains meet each other much more often. Double tracks and complex junctions are needed far more often than single track, making the layouts far more interesting and fun.
To ponder
Look at the player’s experience in your game. Identify the repetitive elements, both things the player has to look at and the things the player has to do. Shrink repetitive elements in time and/or space. Expand interesting gameplay elements to occupy more of the time and space. These changes will reduce realism but increase fun.
Update: [2015-06-25] Added chart showing relationship between reader's time and story's time.
Writing more by writing less #
I have a long list of things I want to write about, but the list is getting longer instead of shorter. I've been thinking lately about my writing process: writing down ideas, fleshing them out, learning a topic, writing a blog post, and making diagrams.
It's fun to write code for diagrams but it takes a long time. Bret Victor's talks make me painfully aware of how limited my tools are. Munificent Bob says he draws his illustrations by hand to save time. LostGarden has beautiful diagrams but it takes me a long time to use those tools. I've pondered a Wacom Cintiq or a Surface or a Galaxy Note or even a regular drawing tablet but I think paper and pen is simplest.
- Big pages: 1-4 months, learning + writing + interactive diagrams. These include Curved Roads, 2d Visibility, and Polygon Map Generation. The Noise Functions page was mostly learning, but I had very few interactive diagrams, so it went quicker. The Hexagons Guide was some learning and some things I already knew, and the interactivity is low, so it went quicker.
- Medium pages: 1-4 weeks, for topics I know, writing + interactive diagrams. Tower Defense Pathfinding and Probability for Damage Rolls would fit in this category. I knew the topics well, so much of the time was figuring out how I wanted to explain it, and implementing the diagrams.
- Small pages: 1-4 days, writing + non-interactive diagrams.
I'm pondering doing more of the small pages. I can upgrade them later if needed.
Labels: making-of
Pathfinding algorithms on grids #
The usual pathfinding algorithms I use — Breadth First Search, Dijsktra's Algorithm, A* — run on graphs. In my previous post I described how grids can be viewed as graphs. Most of the time, pathfinding on grids is fine. However, if you need more performance, grids contain additional structure that standard graph algorithms don't take advantage of. I wrote up some notes about this, either transforming your grid into a smaller graph, or modifying the pathfinding algorithm to harness the structure of grids. It's not something I've had to do in my own projects so if you have additional references or words of advice, I'd love to hear how I can improve that page.

Labels: pathfinding
Graph theory for pathfinding #
While updating my pathfinding pages, I realized that although I cover graph-based pathfinding algorithms, I don't actually explain what graphs are or why we use them. So I wrote a short tutorial on graphs and grids.
Labels: grids , pathfinding
Pathfinding for Tower Defense games #
In a Tower Defense game, you have lots of units that all go to the same place. Instead of repeatedly running a pathfinding algorithm like A*, in some games you can run pathfinding once to all locations, and then have all enemies move along those paths.

I wrote an article about using Breadth First Search to solve pathfinding for Tower Defense.
Things I wanted to experiment with, as I explore how to use interactive diagrams on my pages:
- Sharing: At first, I made each diagram separate, but then I found myself annoyed that edits to one map didn't affect the others. I changed it all to share all state, but then I found that when I ran the search animation for the first diagram, I'd miss the other animations, since they're off the page. So I ended up sharing the graph configuration, but not the search process. Does this behavior match what you want?
- Code Correspondence: I wanted to animate the sample code, showing how it affects the graph. However, that was enough work that I decided to postpone it. Instead, I took a simpler step of color coding the key variables in the algorithm and color coding the diagram with the same colors. What do you think?
- Simplex to Complex: I wanted to show the simplest version of the algorithm first, and then work my way up to more complex algorithms. In this article I show Breadth First Search with only a single destination, and only a grid. I then add parent pointers and distances. In future articles I'll add edges weights (which will lead to Dijkstra's Algorithm), heuristics (Greedy Best First Search and A*), and non-grid graphs. Do you prefer the three diagrams of variants of Breadth First Search separated out, or would you rather have them all presented at once?
While working on it, I ended up spending too much time on tangents:
- Non-grid graphs: too many of my pages use grids, but A* and other graph search algorithms work great on other graphs too. I started thinking about other types of graphs and how to incorporate them into my pathfinding pages. I get distracted easily. I ended up writing all these ideas down for later.
- Exterior corner waypoints: I believe the optimal waypoints for grids will all be at exterior corners. I sketched out a simple way to find these and connect them up into a graph, but I don't have a proof, nor an implementation. That's for a future blog post.
I spent longer than I wanted to spend on this article, but I think it gives me a good foundation for a series of articles, which I'll eventually link together into a new guide to pathfinding algorithms.
Labels: pathfinding
Diagrams on my pathfinding pages #
My A* pages have some diagrams on them that look like this:

Colorful! Pretty! But what do the colors actually mean?
Labels: making-of , pathfinding
Updating the Polygon Map Generator demo #
When I published the Polygon Map Generation article in 2010, I wasn't expecting it to get as much attention as it did. It's now one of the more popular pages on my site. I also got lots of feedback and feature requests. I decided to implement a few of the easier features.
Notes on noise functions and map generation #
Over the summer I decided to study signal processing, with audio and music as potential applications. I should've realized that my brain would get back to maps somehow. I had been writing newbie-level notes for myself using emacs org-mode. Someone asked me about map generation, so I turned the signal processing notes into notes about map generation. Org-mode was really nice for writing notes. It let me mix notes and source code, and then I exported it all to HTML: