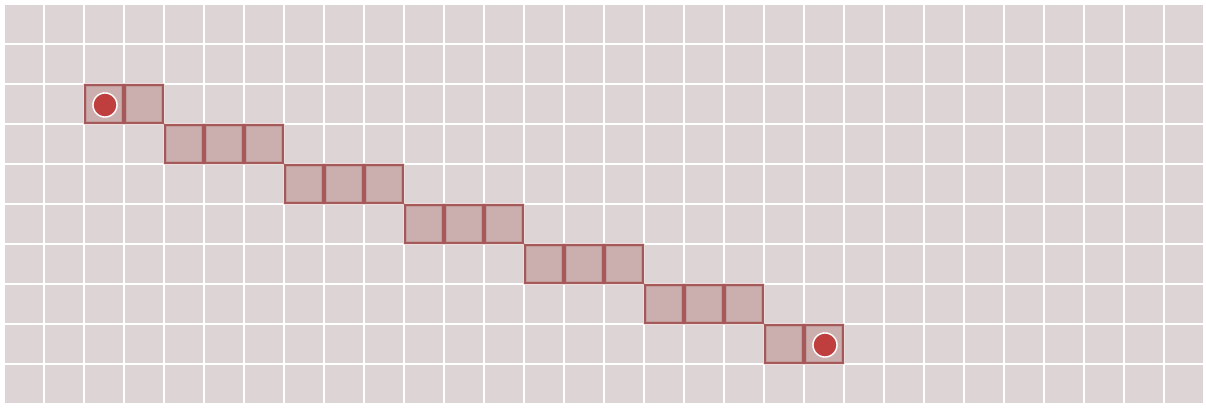
I'm not a fan of Bresenham's line drawing algorithm. I know, it's fast, and sometimes you want to complicate the code for speed. But these days, fast line drawing is going to be done by the graphics library. I only need line drawing for analyzing grid maps in my game. Line drawing performance isn't critical anymore for me, so I prefer using a much simpler algorithm. I decided to write up my notes about that.
I don't like that Bresenham's algorithm has separate cases for 8 octants. You can collapse some of these with a series of if statements, but I prefer interpolation, where there aren't different cases. I don't like that some presentations of Bresenham's algorithm handle only one octant and leave the rest as an exercise to the reader. I don't like that some implementations of Bresenham's swap the endpoints, which is fine for drawing lines, but not as good for game algorithms such as moving an arrow from the player's bow to the enemy orc.
I like that the linear interpolation algorithm reuses concepts that are useful for other parts of my games. I also like that the same line drawing algorithm works on 3d grids and hex grids. I like that interpolation as a concept can be extended to angles, times, spherical rotations, and other things. I like that linear interpolation leads to non-linear interpolation, often used for animation.
Interpolation is both more general and simpler than Bresenham's algorithm. I use it for lots of other things, so I use it for line drawing too, instead of using a different specialized algorithm for line drawing.

I wrote up my notes about line drawing using linear interpolation
What went right?
- Org-mode
I've been trying out emacs org-mode for some of my smaller articles. It worked really well in this case. I used org-babel, which lets me embed source code along with the article text. For each block I can choose whether it gets output as javascript, in the html, or both. The code I present is the same code used to power the diagrams (for the most part).
You can see the org-mode source here.
- Diagram class
I wrote a small diagram class that let me turn on various optional features. I then instantiated it for each of the diagrams on the page, enabling different features for each.
- All the diagrams show a grid.
- Some diagrams show a single interpolation point, controlled through a number control on the page.
- Some diagrams show many interpolation points. The number of points is either calculated automatically or controlled through a number control on the page.
- Some diagrams show a "track" that contains the interpolation points
- Some diagrams show draggable endpoints. In the end, all of them did, but during development I wasn't sure if I'd do that.
I also have various hacks that aren't cleanly put into the diagram class. That's ok. I'm trying to make a pretty page, not make pretty code. I make pretty code only if it helps me make the pretty page more quickly. Unlike most software projects, there's not much maintenance over time, so that up-front investment usually doesn't pay off.
- Draggable numbers
I have a draggable number library that I haven't shared yet, but I've used for a few unfinished projects. I used it here. It's like Bret Victor's Tangle but uses D3 instead of MooTools.
- Draggable markers
I used draggable markers that I explained here and they worked pretty well.
What went wrong?
Scope creep was the biggest problem. It's just line drawing. I thought it'd be quick to write up. But I kept thinking of more things I wanted to add.
- Scope - algorithms
My original plan was to explain two line drawing algorithms, but the more I worked on those, the more variants I started finding. I added the supercover line drawing, but I had several more I wanted to add when I realized … I should just stop and publish the article.
- Scope - topics
As I got into interpolation for 2d grid lines, I realized that other aspects of interpolation are pretty cool too: non-linear interpolation (used in animation "tweens"), hex grid lines, 3d grid lines, interpolation in color space.
I even had written interactive demos for interpolation in different color spaces, comparing RGB, HSL, HCL, Lab, but I ripped it all out when I realized I was going way outside the scope of the page.
- Scope - interactivity
Bret Victor had talked about how the technology of the printing press led us to separate images and text, and we keep doing that on the web even though we don't use moveable type anymore. That made me wonder what kinds of things I'd like to do for explanations that break out of my standard format of text separated from diagrams.
What first came to mind was what I do on paper: I make arrows that point from one thing to another thing, even if it's not in the same "box".
I started implementing this, and was quite happy with what I had, but decided it wasn't worth the effort for this article. I ripped it out, and will try it again for another article. It was a neat effect that I don't see people using. Try mousing over this paragraph, and you'll see an arrow pointing back to the section heading:
In the end…
I needed this small project. I've been sort of stuck since September, so this got me going again. I often find that when I'm stuck, I need to do something simpler, and then work my way up again.
Keep writing these blogs, they're always awesome!
Your grid related posts are a very helpful resource indeed :)
Especially with the very nice illustrations.
Post a Comment