I wanted to generate interesting game maps that weren't constrained to be realistic, and I wanted to try some techniques I hadn't tried before. I usually make tile maps but this time I decided to make polygonal maps. Instead of 1,000,000 tiles, what could I do with 1,000 polygons? I think the distinct player-recognizable areas might be useful for gameplay: locations of towns, places to quest, territory to conquer or settle, pathfinding waypoints, difficulty zones, etc.
There were three main things I wanted: good coastlines, mountains and rivers. For the coastline, I wanted to make island/continent maps that are surrounded by ocean, so that I don't have to deal with people walking to the edge of the map. For the mountains, I started with something simple: mountains are whatever's farthest from the coastline. For the rivers, I started with something simple: draw rivers from the coast to the mountains.
The full article is here. There's also a demo and source code.
Polygons
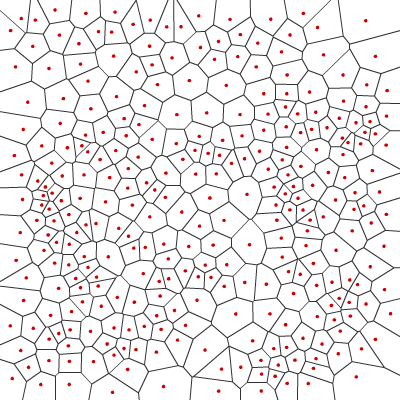
The first step is to generate some polygons. I picked random points and generated Voronoi polygons, which are used for lots of things, including maps. Here's an example of random dots (red) and the polygons that result:

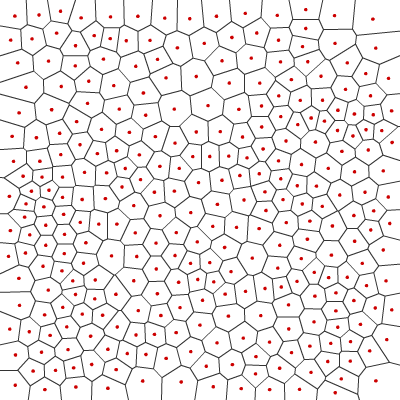
The first problem is that polygon shapes and sizes are a bit irregular. Random numbers are more “clumpy” than what people expect. What I really want is semi-random “blue noise”, not random points. I approximate that by using Lloyd relaxation, which is a fairly simple tweak to the random point locations to make them more evenly distributed. Here's the result after running Lloyd relaxation twice:

Compare it to running once or fifty times. The more iterations, the more regular the polygons get. Running it twice gives me good results but every game will vary in its needs.
[2010-09-22] The second problem with the polygons is that some edges are very short. For games where boundaries between polygons matters, having short edges is a problem. We can adjust the edge lengths by moving corners, but we lose the Voronoi properties. Since I'm using Voronoi only to generate polygons, and do not need to preserve the Voronoi properties, I move the corners to the average of the polygon centers they touch. Note: I added this code after the initial blog post, and did not update diagrams to show this step.
Map Representation
I'm representing the map as two related graphs: nodes and edges. The first graph has nodes for each polygon and edges between adjacent polygons. It represents the Delaunay triangulation, which is useful for anything involving adjacency (such as pathfinding). The second graph has nodes for each polygon corner and edges between corners. It contains the shapes of the Voronoi polygons. It's useful for anything involving the shapes (such as rendering borders).
The two graphs are related. Every triangle in the Delaunay triangulation corresponds to a polygon corner in the Voronoi diagram. Every polygon in the Voronoi diagram corresponds to a corner of a Delaunay triangle. Every edge in the Delaunay graph corresponds to an edge in the Voronoi graph. You can see this in the following diagram:

Polygon A and B are adjacent to each other, so there is a (red) edge
between A and B in the adjacency graph. For them to be adjacent there
must be a polygon edge between them. The (blue) polygon edge connects
corners 1 and 2 in the Voronoi shape graph. Every edge in the
adjacency graph corresponds to exactly one edge in the shape graph.
In the Delaunay triangulation, triangle A-B-C connects the three
polygons, and can be represented by corner 2. Thus, corners in the
Delaunay triangulation are polygons in the Voronoi diagram, and vice
versa. Here's a larger example showing the relationship, with Voronoi
polygon centers in red and corners in blue, and the Voronoi edges in
white and the Delaunay triangulation in black:

This duality means that I can represent the two graphs together. Edges are the key. Each edge in a normal graph points to two nodes. Instead of representing two edges in the two graph separately, I made edges point to four nodes: two polygon centers and two corners. It turns out to be quite useful to connect the two graphs together.
With the combined representation, I can now use the Relationships Between Grid Parts sections of my article on grids. They're not grids so I'm not assigning grid coordinates, but many of the algorithms that work on grids also work here, and the algorithms that work on graphs also work here (on either of the two graphs).
Islands
The second step is to draw the coastline. I used a simple function to divide the world into land and water. There are many different ways to do this. You can even draw your own shapes, e.g., a skull island. The map generator works with any division of points, but it forces the outer layer of polygons to be ocean. Here's an example that divides the world into land and water:

A simple flood fill starting from the border of the map can determine which water areas are oceans (connected to the border) and lakes (surrounded by land):

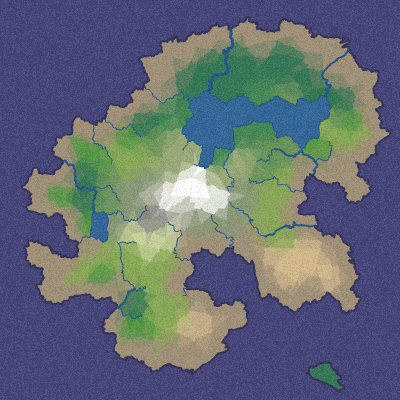
In the next two blog posts (part 2, part 3) I'll describe how I add elevation data to build mountains and valleys, add moisture data for lakes and rivers, render the map so that it doesn't look polygonal, and conclude with the demo and source code. Together, elevation and moisture produce a good range of terrain and map features. The goal is to produce maps like this:

Update: [2010-09-22] Since the original blog post, I added a corner adjustment step to lengthen short edges. Just as Lloyd relaxation improves the polygon sizes, I needed to adjust the edge lengths. The adjustment does not preserve Voronoi properties, but I'm not using those properties so it worked out. I didn't update diagrams to reflect this change. I also improved map rendering and replaced the last diagram on this page. I originally wanted to have a rendering that didn't show the polygons at all, but couldn't get it to work in time, so at the time of the blog post I used this rendering instead. The rendering technique is described in the full article but not in the blog posts.
Wow, thats definitve the best map generator I've ever seen. This generated map is so random and realistic at the same time.
Keep the good work on, Amit!
(lol Comment system ate my first comment)
Great post. Mitchell's best-candidate sampling algorithm is another easy way to generate blue noise. There's also Dunbar & Humphrey's approach, which seems attractive on paper but I've not yet been motivated to implement it.
Thanks Alex and Mike! While looking for blue noise I found Mitchell's algorithm (paper without registration requirement) and Dunbar & Humphrey's paper. Both looked interesting but an approximation to Lloyd's algorithm is so little code that it beat everything else in terms of the results-to-effort ratio. Instead of computing the centroid I just average the vertices (although centroid isn't much more code), and get good results. In the full post I'll mention that it's only an approximation to Lloyd's algorithm.
This article is so interesting! I look forward to the next part(s)!!
Thanks for the post; I really enjoyed reading it. I look forward to the next part! Out of curiosity, how did you go about creating the Voronoi polygons out of the points? Did you use Fortune's algorithm or some other method?
Hi Zach — I used Fortune's algorithm, but didn't implement it myself. I used the as3delaunay package from nodename. I made a minor change to that package to expose the Edge list.
Amit, you taught me A* when I needed that, and now, as if by magic, just as I was trying to work out how to achieve a nice map effect for a 2D game that wasn't based on a Perlin heightmap, you write this guide. Thank you, thank you, thank you! :)
Cylindric, glad I could help! :)
Amit you are awesome :D
Your time and articulated verbose is much appreciated. This site is going straight to my favorite bookmarks repo!
Hi!
Thanks for that site and the lots of informations!!
I tried the demo, when I export the xml it does not include edges ... is that correct??
Hi Zet,
Sorry about that! jterrace fixed the bug here but I forgot to upload a new version to this page :( It should be fixed now.
Hi Amit
How do you handle the generation of the proximity map?
Originally I tried to use the graphics library in AS3 http://www.avanderw.co.za/voronoi-experiment/ and ran into issues around the lines drawn being anti-aliased. That would throw out the index lookup on the edges of the voronoi cell.
My naive solution was to threshold the cell that was drawn before adding it to the proximity map. The alternative, which I have coded but not uploaded, was to use bresenheim to draw the border of the cells afterwards using a floodFill method to colour it. Which resulted in a much faster implementation...
Interested in how you do it.
Hi Andrew,
I disabled antialiasing as much as possible by using stage.quality = 'low' . I think this works fine on polygon fills and I thought it also worked on lines.
Post a Comment